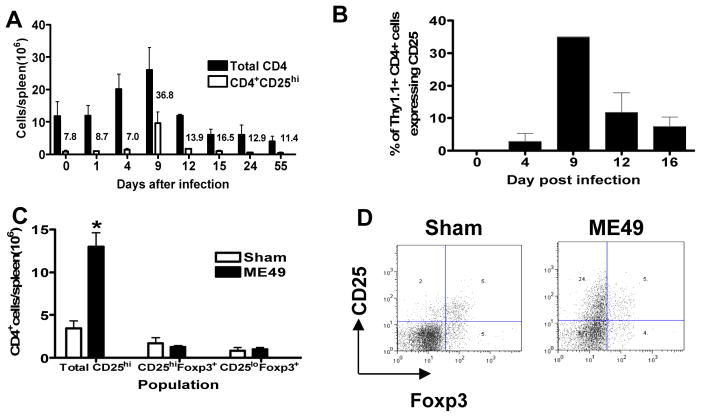
Fig. 2. Transient upregulation of CD25 on effector T cells during acute T. gondii infection.
(A) Total numbers of splenic CD4+ T cell and CD4+CD25hi T cells were calculated on selected days following oral T. gondii infection. CD25 detection was performed using the PC61 clone anti-CD25 antibody. Bars show means +/− std. dev. Numbers above bars for CD4+CD25hi cells indicate the percentage of that population within the total CD4+ T cell population. (B) Cell sorted Thy1.1+CD4+CD25− cells were adoptively transferred into Thy1.2+ B6 mice prior to oral T. gondii infection. The frequency of adoptively transferred donor cells expressing CD25 in the spleen was determined on selected days post-infection. (C, D) In a separate experiment, groups of 5 B6 males were infected as in panel A, and spleens harvested on day 8 to analyse the percentage of CD4+CD25hi cells that co-expressed Foxp3. (C) The numbers of CD4+CD25hi cells and CD4+Foxp3+ cells and (D) representative dot plots gating on CD4+ T cells showing CD25 expression versus Foxp3 expression in naïve and T. gondii infected mice. Mean+ std. dev. numbers of indicated CD4+ populations are shown. *, p<0.01.

