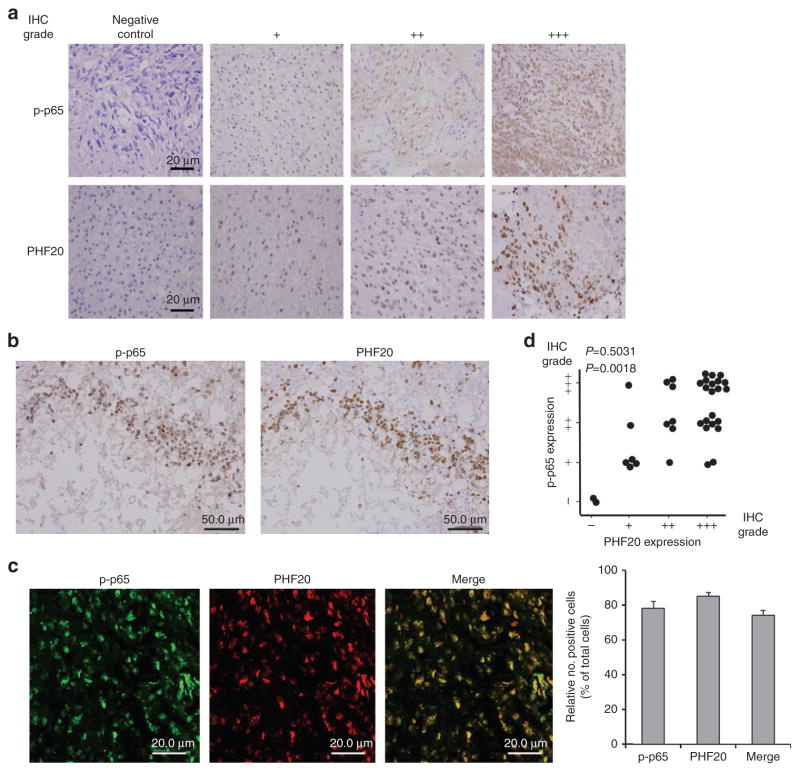
Figure 6. p-p65 levels are associated with PHF20 expression in primary human glioma specimens.
(a) Immunohistochemical staining of p-p65 and PHF20 in paraffin-embedded tissue specimens from 36 glioma patients. Negative control with exclusion of primary antibody. The intensity of histological staining grade was scored using a four-point scale: −, no staining, +, weak staining, + + intermediate staining and + + + strong staining. Each representative case was shown (original magnification, × 400). Scale bar, 20 μm). (b,c) Representative image of colocalization between p-p65 and PHF20 expression in the nuclei of the glioma tumour cells. (b) Serial sections of tissues were prepared and stained simultaneously with anti-p-p65 and anti-PHF20 antibodies. Scale bars, 50 μm. (c) Immunofluorescence images of colocalization of p-p65 and PHF20 in glioma tissue specimen (grade IV, original magnification, × 600). Merge: the merge images represent the merging of p-p65 (green) and PHF20 (red) immunofluorescent staining (Scale bars: 20.0 μm). The percentage of cells with immunopositive staining was quantified by counting the number of positive cells by ImageJ Colocalization Plugin software at original magnification × 20 (mean±s.e. of triplicate, (right)). (d) Correlation between the expression levels of p-p65 and PHF20 were determined by the χ2 test or linear-by-linear association in 36 collected human glioma samples (P = 0.0018).

