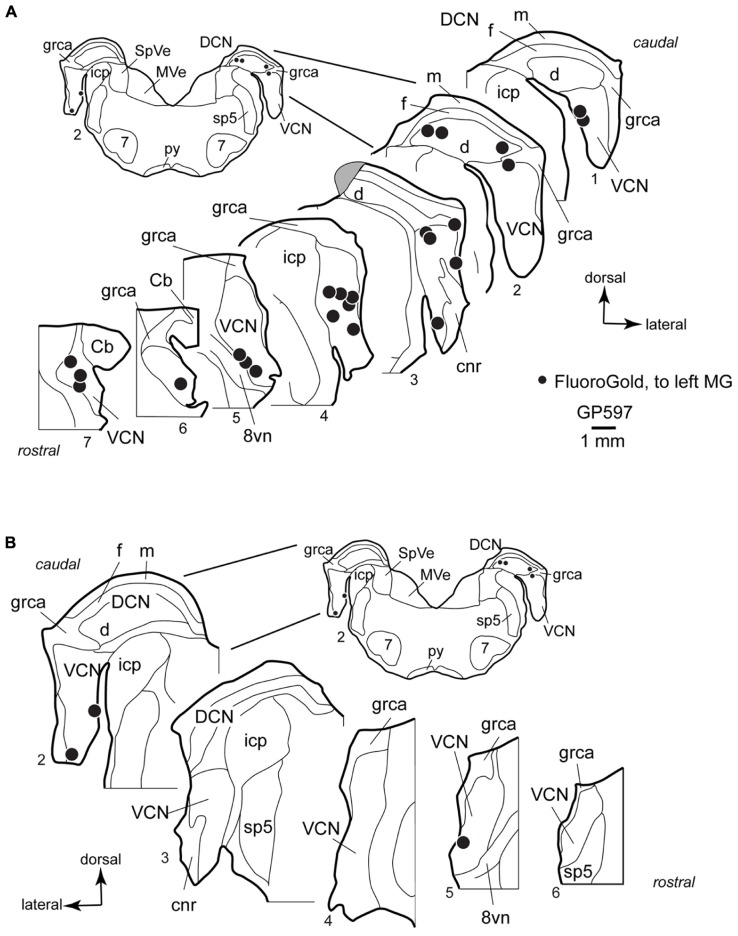
FIGURE 3.
Plots showing the distribution of labeled cells in the cochlear nucleus following a large injection of FluoroGold into the left medial geniculate body. Enlargements of the cochlear nucleus are shown, with the inset providing orientation. Plots are contralateral (A) or ipsilateral (B) to the injection. A photograph of the injection site for this case is presented below (Figure 6C). Each black dot represents one or more labeled cells. Sections are numbered from caudal to rostral and are spaced 300 μm apart. See list for abbreviations. Gray area in A, Section 3, indicates tissue damaged during processing.

