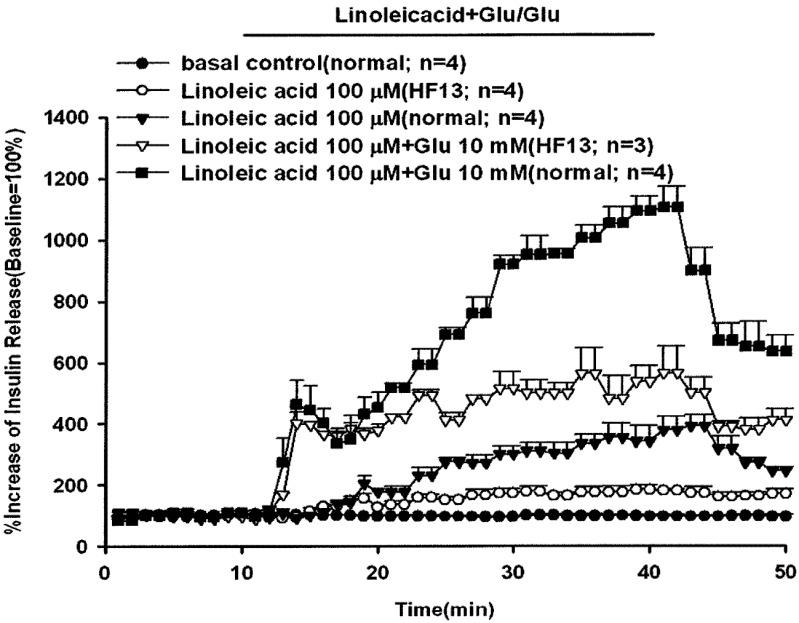
Fig. 5.
Effect of linoleic acid with or without glucose on insulin release in rats fed a high-fat diet for 13 weeks (HF 13). In pancreatic perfusion experiments, an equilibration period of 20 min preceded time 0. After a baseline period of 10 min, 100 µM linoleic acid with or without 10 mM glucose was administered for 30 min followed by a basal medium (KRB) perfusion. The horizontal line indicates the presence of linoleic acid and glucose. Values are means ± SE (n=4). Baseline effluent concentrations of insulin were 4,172 ± 277 pg/ml, 6,463 ± 2,373 pg/ml, 1,199 ± 127 pg/ml, 3,178 ± 318 pg/ml and 1,626 ± 298 pg/ml for the control, linoleic acid (high-fat diet), linoleic acid (normal diet), linoleic acid with glucose (high-fat diet) and linoleic acid with glucose (normal diet) groups, respectively.

