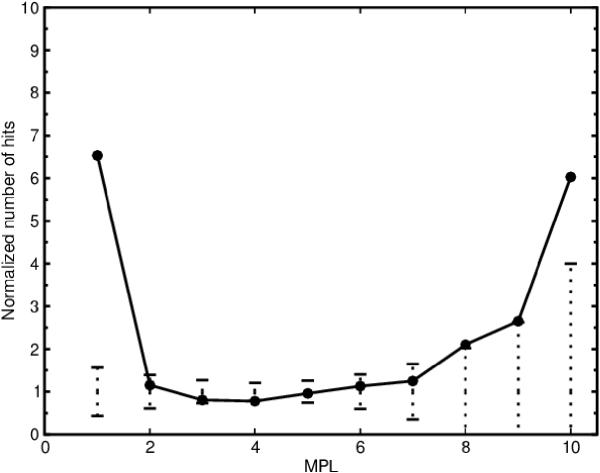
Figure 9.
Homology vs minimal path length (MPL) without the 20 most promiscuous compounds for functionally similar enzyme pairs. The plots show the correlation between homology and MPL for functionally similar (shared primary EC number) enzyme pairs when the 20 most promiscuous compounds have been removed. The solid line represents the metabolic network of E. coli. The dotted vertical lines represent three standard deviations of the number of homologous enzyme pairs for the randomized networks. The number of homologous enzyme pairs has been normalized by the average number of homologous enzyme pairs for the randomized networks.

