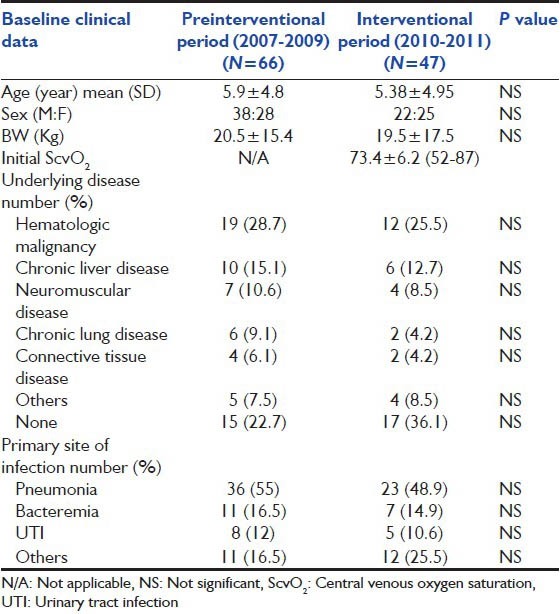
Table 1.
Baseline demographic data of subjects enrolled in the study compared between preinterventional period (2007-2009) and interventional period (2010-2011). (Data represent as mean ± standard deviation)

Baseline demographic data of subjects enrolled in the study compared between preinterventional period (2007-2009) and interventional period (2010-2011). (Data represent as mean ± standard deviation)
