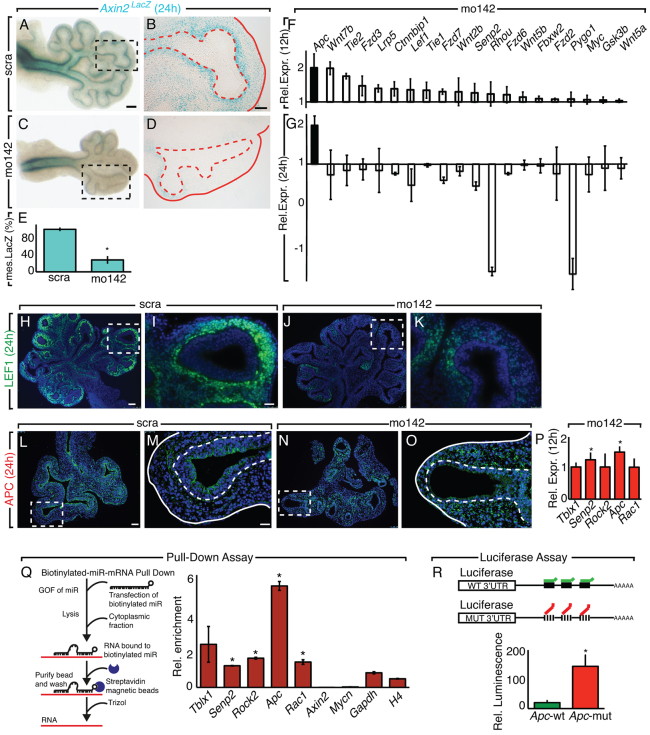
Fig. 2.
miR-142-3p regulates WNT signaling by direct control of Apc expression. (A-E) miR-142-3p LOF assay on Axin2lacZ E11.5 lung explants. Lung explants (A,C) and vibratome sections (B,D) are shown 24 hours after miR-142-3p LOF assay. Mesenchymal β-gal is quantified in E. (F,G) Members of the WNT signaling pathway were quantified by qPCR 12 and 24 hours after the miR-142-3p LOF assay. (H-K) LEF1 expression 24 hours after the miR-142-3p LOF assay. (L-O) APC expression after the miR-142-3p LOF assay. Immunofluorescence for APC 24 hours after scra (L,M) and mo142 (N,O) treatment. Dashed boxes indicate the magnified area shown in the panels to the right. Dashed lines in M and O demarcate the epithelium-mesenchyme boundary. (P) Quantification by qPCR of miR-142-3p predicted targets 12 hours after miR-142-3p LOF assay. (Q) Quantification by qPCR of miR-142-3p predicted targets after biotin mRNA-miRNA pull down assay. (R) Luciferase assay for Apc seed sequences on MLg cells. Scale bars: 150 μm (A,C); 100 μm (B,D); 75 μm (H,J,L,N); 25 μm (I,K,M,O). Data are means ± s.d. See also supplementary material Fig. S2.

