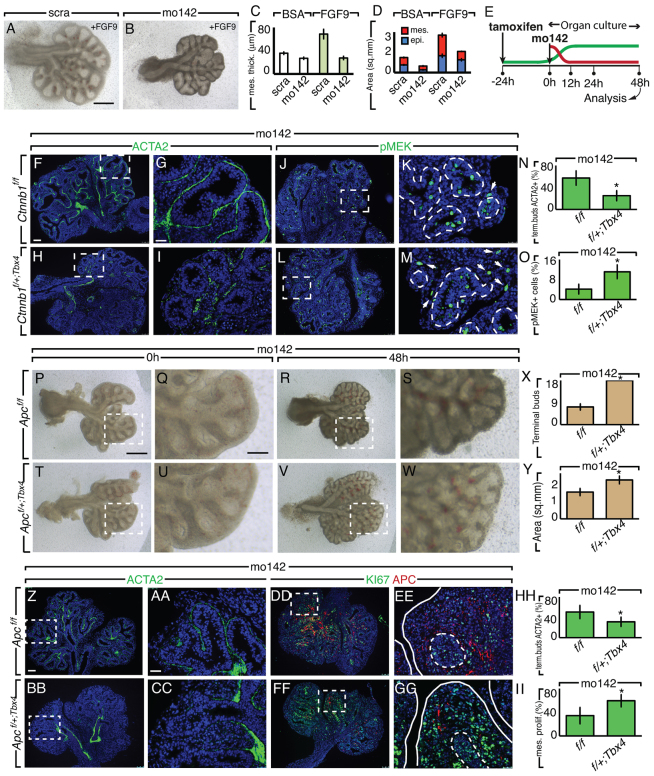
Fig. 5.
Stabilized Ctnnb1 expression or decreased Apc expression in the mesenchyme counteracts the effect of miR-142-3p inhibition on proliferation and differentiation. (A-D) FGF9 (200 ng/μl) was administrated to E11.5 lung explants cultured in the presence of scra (A) or mo142 (B), and mesenchyme thickness (C) and epithelial and mesenchymal surfaces (D) were measured. (E) Schematic showing the time line of the experimental treatment. The green and red lines depict tamoxifen and mo142 effects, respectively. (F-O) E11.5 lung explants harboring a mesenchymal stabilized form of Ctnnb1 obtained by Tbx4-driven Cre expression, and control lungs were treated with mo142 and immunostained for ACTA2 (F-I) or pMEK (J-M). Quantification of ACTA2 and pMEK are shown in N and O, respectively. (P-II) E11.5 lung explants with mesenchymal deletion of Apc by Tbx4-driven Cre expression (P-S) and control lungs (T-W) were treated with mo142 and their morphometry was analyzed (X,Y). Immunostaining for ACTA2 and APC (Z-CC) or KI67 and APC (DD-GG) from the previous experiment and its relative quantification (HH,II). Dashed boxes indicate the magnified areas in the adjacent panels. Dashed lines demarcate the epithelium-mesenchyme boundary. Scale bars: 250 μm (A,B); 75 μm (F,H,J,L); 25 μm (G,I,K,M); 250 μm (P,R,T,V); 50 μm (Q,S,U,W); 75 μm (Z,BB,DD,FF); 25 μm (AA,CC,EE,GG). Data are means ± s.d. See also supplementary material Fig. S3.

