
Fig. 7.
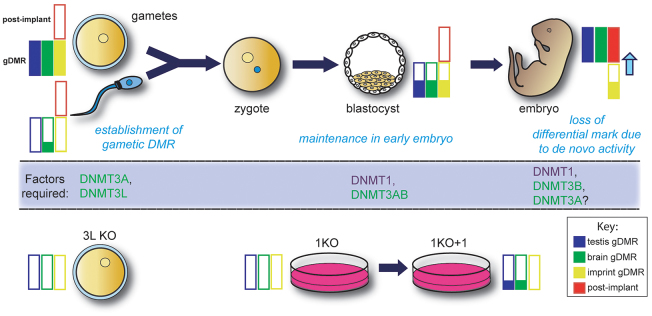
Methylation dynamics and methyltransferase dependency of genes inheriting methylation from the mother. (Top) Methylation ontogeny of brain, testis and imprinted gDMRs, as well as of postimplantation genes. The average methylation of each gene class (see key, bottom right) is shown: filled bar, 100% methylation; empty bar, 0% methylation. Methyltransferase requirements at different stages, where established, are shown within the central blue panel. (Bottom) The effect of loss and restoration of methyltransferase activity in different experimental systems. The dish on the right represents ESCs.