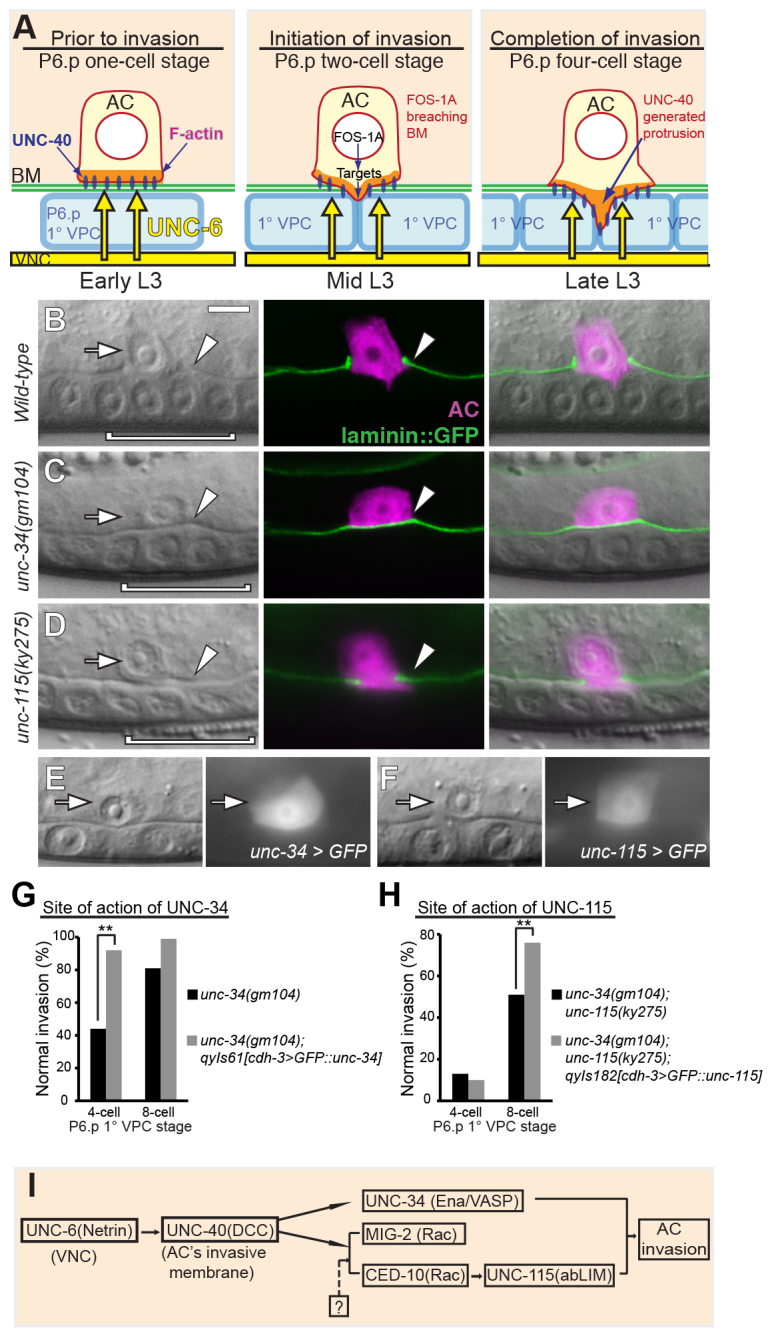
Fig. 1.

AC invasion and downstream effectors of UNC-40. Anterior is left; ventral is down; and arrows point to the AC in this and all other figures. (A) A schematic diagram of AC invasion in C. elegans. In the early L3 larva the AC is attached to the basement membrane (BM, green) over the primary vulval precursor cell (1° VPC; light blue, P6.p one-cell stage, left). UNC-6 (netrin) (yellow arrows) secreted from the ventral nerve cord (VNC) polarizes its receptor UNC-40 (blue ovals) and F-actin (orange) to the invasive cell membrane in contact with the basement membrane. During the mid-L3, after P6.p divides (P6.p two-cell stage, middle), the AC breaches the basement membrane and generates a protrusion that invades between the two central 1° VPC granddaughter cells by the late L3 (P6.p four-cell stage, right). The transcription factor FOS-1A promotes basement membrane breaching and the UNC-6 receptor UNC-40 mediates protrusion formation. (B-D) DIC images (left), corresponding fluorescence (middle), and overlay (right). (B) In wild-type animals, the AC (arrow, magenta, expressing zmp-1 >mCherry) breaches the BM (arrowhead, green, visualized by laminin::GFP) and contacts the central 1° VPCs (bracket) at the P6.p four-cell stage. (C) In this unc-34 mutant AC invasion failed, leaving the BM intact (arrowhead). (D) In this unc-115 mutant the AC (arrow) partially removed the BM (arrowhead). (E,F) Transcriptional reporters for unc-34 (unc-34 >GFP) and unc-115 (unc-115 >GFP) genes are expressed in the AC (arrows) throughout invasion. (G,H) Quantification of the normal percentage invasion of unc-34 mutants, unc-34 mutants expressing AC-specific UNC-34, unc-34;unc-115 double mutants, and unc-34;unc-115 mutants expressing AC-specific UNC-115 at the P6.p four- and eight-cell stages (n≥50 for each stage per genotype). We utilized the strong enhancement of unc-34 by unc-115 as a sensitive assay for UNC-115 rescue. (I) A diagram of the genetic organization downstream of UNC-6 and UNC-40. As the ced-10 allele was not null, our genetic analysis cannot rule out that CED-10 and MIG-2 are partially controlled by another signal (question mark). In this and all other figures, *P<0.05, **P<0.01, ***P<0.001, N.S., no significant difference (Student’s t-test). Scale bar: 5 μm.
