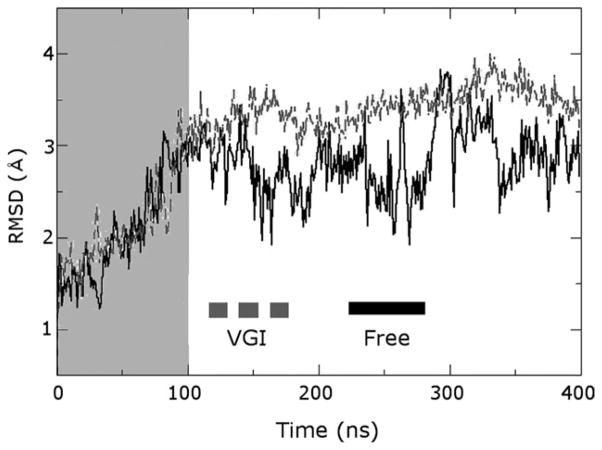
Figure 2.
RMSD plot illustrating structural fluctuations occurring in molecular dynamics trajectories. RMSD from the initial minimized structure for the protein Cα atoms is shown as a function of time for simulations of the free and ligand-bound enzymes as black and gray lines labeled “Free” and “VGI”, respectively (this nomenclature is maintained in the remaining figures). Regions highlighted by the gray box were considered part of the equilibration period and were not employed for analysis. Note the much larger fluctuations in simulations of the free enzyme and the equilibration time of about 100 ns for each trajectory.

