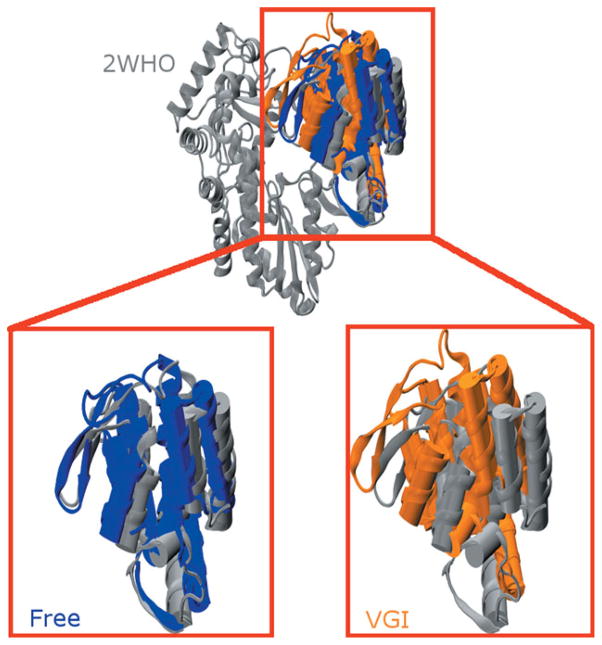
Figure 3.
Structural comparison of average structures from the MD simulations with the 2WHO crystallographic coordinates. (Upper Panel) MD average structures from simulations with (orange) and without (blue) ligand superimposed on 2WHO (gray). All three structures were aligned using the protein backbone of residues in the palm and fingers domains. For clarity only the thumb domain of the free enzyme and ligand-bound simulations is shown so structural differences in the thumb domain can be clearly delineated. (Lower Panel) Magnified views of the highlighted region in the top panel comparing the thumb domain structure found in 2WHO with those found in the free enzyme (left) and ligand-bound (right) structures. Note that the β-loop of the free enzyme (left side of the thumb domain) assumes a structure that is similar to that found in the crystallographic coordinates. This loop becomes closer to the fingers domain in the ligand-bound enzyme in what we have designated as a “hyper-closed” conformation. Average structures were computed using all 300 ns of equilibrated trajectory data.

