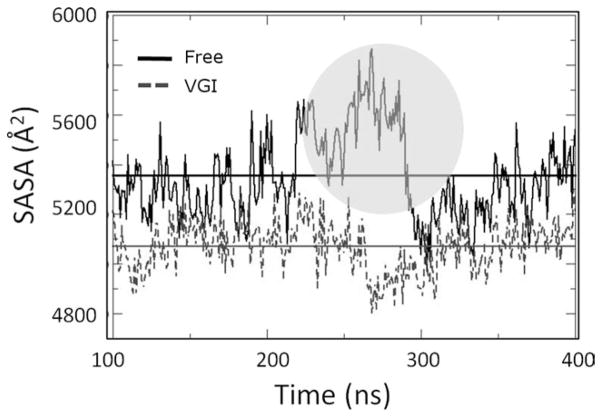
Figure 4.
Solvent accessible surface (SASA) computed for residues along the RNA template channel during equilibrated portion of protein trajectories. Values for ligand-free and ligand bound simulations are shown as solid and dashed lines, respectively. Horizontal lines denote the averages computed for each simulation (also see Table I). Note that the average SASA is significantly greater for the free enzyme simulation. Also note the significant increase in SASA that occurs for this trajectory after about 265 ns of total simulation time (circled region). Increased SASA values coincide with the structural changes described in the text.

