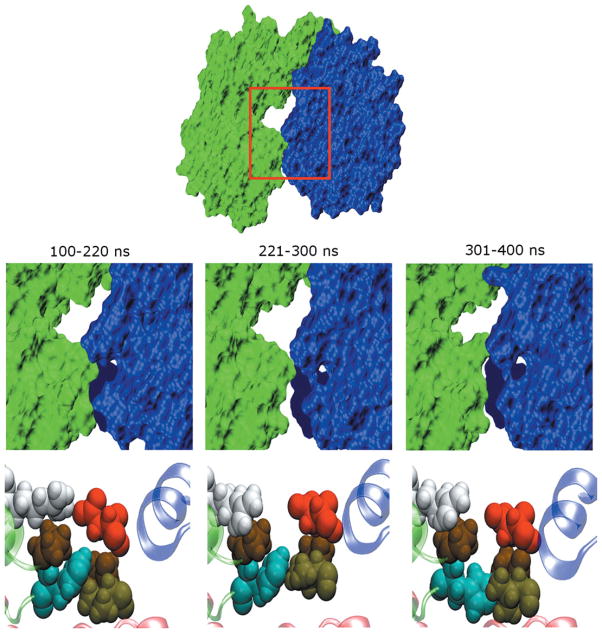
Figure 5.
Structural changes that accompany variations of SASA in the free enzyme. The free trajectory can be divided into time segments (labeled) that contain similar SASA values. (Upper panels) Surface representations of the average structures computed for each segment. The fingers domain is drawn in green while the thumb domain is in blue. The viewpoint shown corresponds to a 90° rotation about the horizontal axis relative to that in Figure 1, so that we are looking down on the top of the enzyme. The space between the two domains becomes slightly larger during 221–300 ns. (Lower panel) Conformations of residues at the interface between fingers and thumb domains. Magnified views of region enclosed by red boxes in top panel. Residues P94, H95, R109, V405, P404, and D444 are shown in space filling representation. H95, R109, V405, and D44 are colored cyan, white, light brown and red, respectively, while the two proline residues are displayed in dark brown. The perspective corresponds to that shown on the left side of Figure 1. The large changes in SASA observed for the enzyme are linked to repacking of the side chains of these residues. Note that these residues become much more loosely packed in that segment of the trajectory with larger interdomain separation.

