Figure 6.

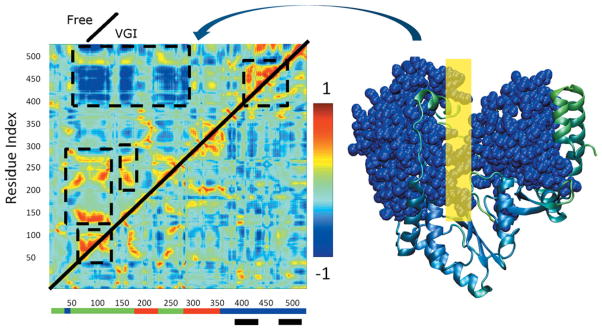
(Left) Normalized covariance matrices showing correlated motion between Cα atoms in NS5B. Indices along the axes denote position along the amino acid sequence. Color scale shown on right ranges from −1 for maximally anticorrelated motion through 1 for maximally correlated motion. Upper diagonal: free enzyme simulation. Lower diagonal: ligand-bound simulation. Regions where correlation in the free enzyme differs from that in the ligand bound simulations are indicated by dashed black lines. Colored bars at base of plot indicate locations of the fingers (green), thumb (blue), and palm (red) domains. Black bars indicate the location of the inhibitor binding site. A space filling representation of the regions engaged in large scale anticorrelated movement involving thumb and fingers domains are shown in blue in the representation of the protein on the far right. The corresponding region of the covariance plot is indicated by the curved arrow. The yellow rectangle on the right indicates the approximate location where the RNA template strand binds to the enzyme.
