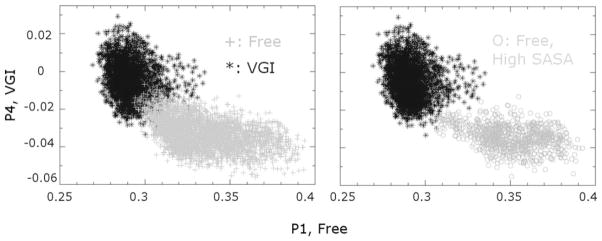
Figure 7.

Using principal components to categorize the conformational space explored in MD simulations of the free and ligand-bound enzyme. Coordinates for each snapshot of the two trajectories are projected unto the lowest frequency principal component identified in simulations of the free (x axis) and ligand-bound (y axis) enzyme that discriminates between the two trajectories. (Left) Each point in the plot indicates a distinct position in the protein conformational space for the free and ligand-bound trajectories. Note that there is little overlap between the conformations sampled in the two sets of simulations. (Right) Conformations of the free enzyme with increased SASA values for the RNA template channel (circles) are found in a distinct region of conformational space, indicating that specific conformations are associated with larger SASA values and thus greater separation between the fingers and thumb domains. Also note that, in general, these conformations are less similar to conformations of the ligand-bound protein than the conformations of the free enzyme.
