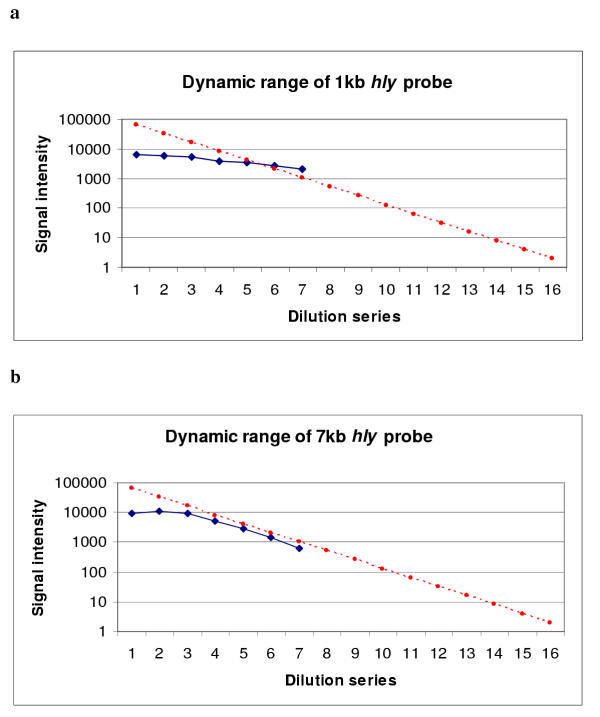
Figure 1.

Signal intensities of a two fold genomic DNA dilution series probed with 1 kb (a) or 7 kb (b) direct labeled hly Cy5 probe. The blue dots represent spotting concentrations from 4 μg/ul to 0.125 μg/ul plus a negative control (the last spot in the series). The red line represents the simulated ideal signal responding line for a 2 fold dilution series that covers the whole signal spectrum of the scanner (16 bit image). This ideal responding slope is dictated by the logarithm of the dilution factor [log (0.5) = -0.3]. The background signal (represented by the last blue spot in the series) is much higher in 1 kb hybridization than that of 7 kb hybridization because the laser power and detector sensitivity setting of the scanner was increased in order to obtain analyzable signals.
