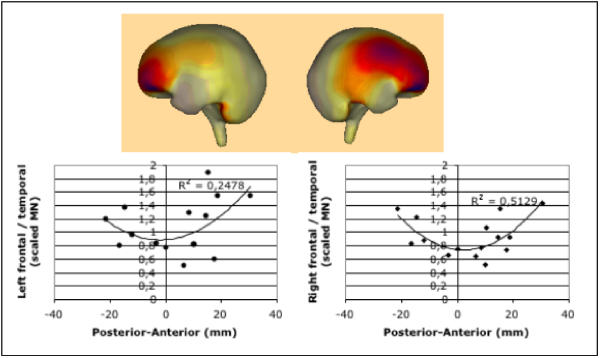
Figure 3.

Upper panel: The minimum-norm solution for the difference between the Grand Means of the tinnitus and the control groups indicates a greater prefrontal activity (dark shading) in tinnitus patients following auditory stimulation. The darkest shading corresponds to 100% of the maximum activation (the ligther, the stronger the decrease relative to the maximum). This exploratory analysis was the basis for the post-hoc notion that the source localization in the anterior-posterior direction may be associated with prefrontal activity. Lower Panel: Correlating relative frontal activity (as compared to temporal sources) of each individual with the source location of the regional source results in a quadratic trend that is more pronounced for the right hemisphere.
