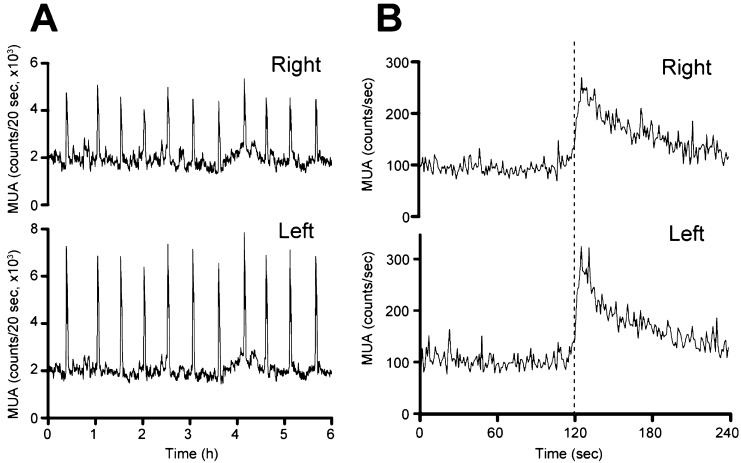
Fig. 1.
Representative profiles of MUA in the OVX goat. A: MUA signals (counts/20 sec) simultaneously recorded (for 6 h) from the right (upper panel) and left (lower panel) sides of the ARC. B: Detailed MUA signals (counts/sec; upper panel, right side; lower panel, left side) measured around one spontaneously occurring MUA volley. The dotted line indicates the onset of the MUA volley.

