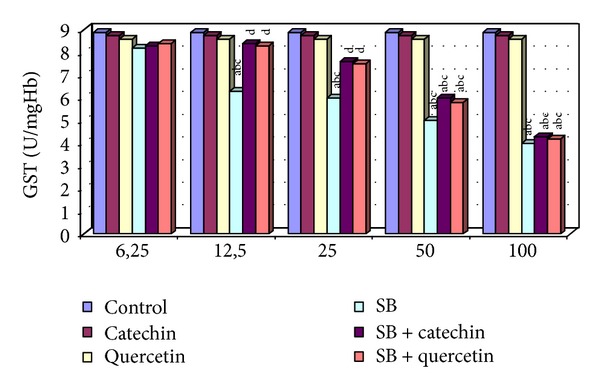
Figure 5.

GST activity in erytrocytes of control and experimental groups. Different letters above the bars indicate significant differences between exposure concentrations; bars with the same letter are not significantly different. Values are mean ± SD in each group. Significance at P < 0.05.
