
Figure 3.
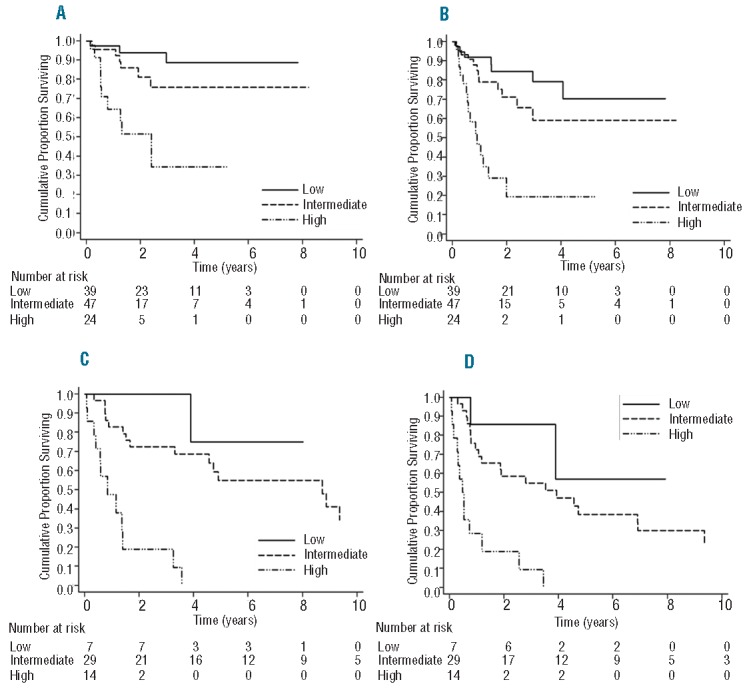
OS according to HCV prognostic score (HPS) categories in the subgroup of patients treated with R-CHOP (A); PFS according to HCV prognostic score (HPS) categories in the subgroup of patients treated with R-CHOP (B); OS according to HCV prognostic score (HPS) categories in the subgroup of patients treated with CHOP (C); PFS according to HCV prognostic score (HPS) categories in the subgroup of patients treated with CHOP (D).