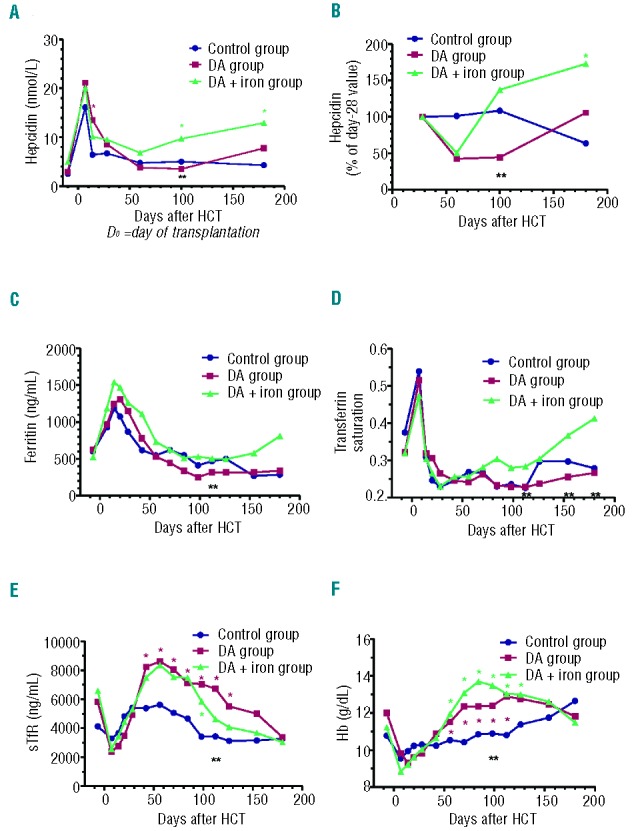
Figure 1.

Temporal evolution of mean hepcidin (absolute values (A) and percentage of Day-28 values (B)), ferritin (C), transferrin saturation (D), sTfR (E) and hemoglobin (F) following transplantation in the 3 groups. *Comparisons between either the DA group (*in red) or the DA + iron group (*in green) and the control group, P<0.05. **Comparisons between the DA group and the DA + iron group, P<0.05.
