Figure 6.
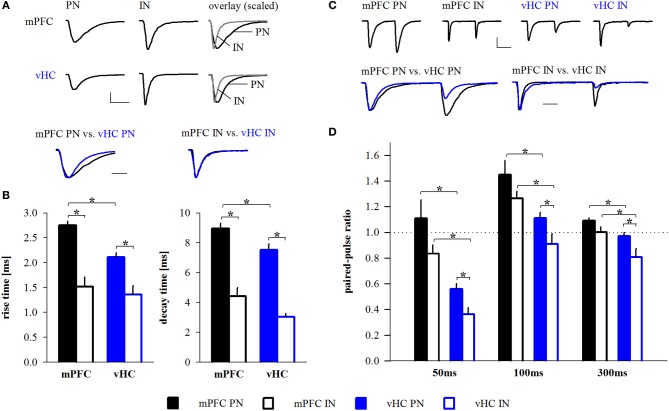
Properties of mPFC- and vHC-evoked EPSCs in BA neurons. (A) Example traces of EPSCs recorded at −70 mV in BA principal neurons (PN) and interneurons (IN) receiving input from mPFC (top) or vHC (middle) and amplitude-scaled overlays showing faster rise and decay of EPSCs in IN. Amplitude-scaled overlays of mPFC- or vHC-evoked EPSCs in PNs and INs show faster EPSCs of vHC inputs in PNs (bottom). Scale bars: 100 pA/10 ms (top) and 5 ms (bottom). (B) Summary graphs for rise and decay times of EPSCs in PNs and INs for mPFC (black) and vHC inputs (blue), all values are in Table 2 (all PNs) and Table 5 (all INs). Rise and decay times were significantly faster for mPFC inputs onto INs vs. PNs (rise time: p < 0.001; decay time: p < 0.001) and vHC inputs onto INs vs. PNs (rise time: p = 0.002; decay time: p < 0.001). vHC inputs evoked faster EPSCs in PNs than mPFC inputs (rise time: p < 0.001, decay time: p = 0.01). (C) Example traces of EPSCs evoked by paired pulse stimulation (interval: 50 ms) at −70 mV in PNs and INs after stimulation of mPFC (top left) or vHC (top right) inputs. Overlays scaled to the amplitude of the first EPSC illustrate differences in paired pulse ratio (bottom). Scale bars: 100 pA/25 ms (top) and 10 ms (bottom). (D) Summary graph for paired pulse ratios (PPR) of EPSCs at different stimulation intervals in PNs and INs for mPFC (black) and vHC inputs (blue), all values are in Table 2 (all PNs) and Table 5 (all INs). PPRs of mPFC inputs onto INs vs. PNs were not significantly different (p > 0.05 for all intervals). PPRs of vHC inputs onto PNs vs. INs were significantly larger (*p < 0.05 for all intervals). PNs and INs receiving mPFC input showed significantly larger PPRs than PNs and INs receiving vHC inputs (PN: *p < 0.01; IN: *p < 0.05 for all intervals).

