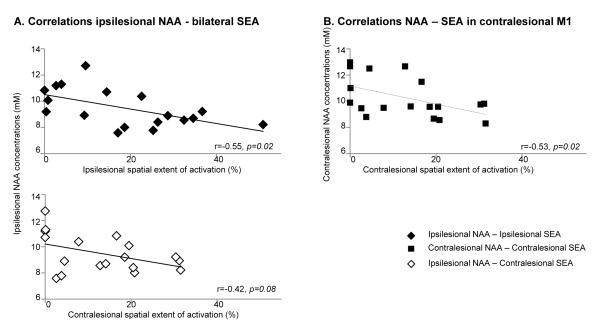
Fig. 2.
A. Changes (%) in concentrations of NAA (black) and mI (light grey) in M1, PMd, and SMA in both hemispheres in stroke survivors versus controls. Note that NAA is lower in ipsilesional M1 (p=0.04) and SMA (p=0.004) and mI is higher in M1 (p=0.003) and PMd (p=0.03). B. Correlations between NAA concentrations in contralesional M1 (black circle), ipsilesional M1 (diamond), ipsilesional PMd (triangle), and ipsilesional SMA (square) and proximal FMUE subscores.

