
Figure 3.
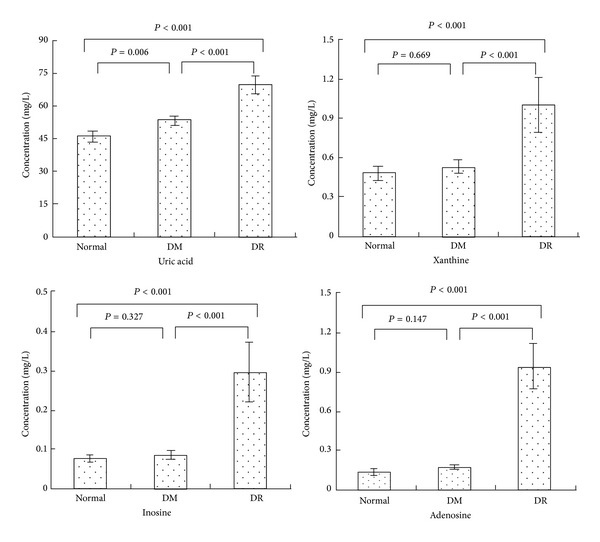
Comparison of four potential biomarkers concentrations in healthy subjects (normal), type 2 diabetes patients without retinopathy (DM), and type 2 diabetes patients with retinopathy (DR). Compared to the group of normal and DM, DR subjects had significantly higher mean plasma concentrations of inosine (P < 0.001, P < 0.001), adenosine (P < 0.001, P < 0.001), uric acid (P < 0.001, P < 0.001), and xanthine (P < 0.001, P < 0.001). The group of DM had significantly higher mean plasma concentrations of uric acid (P = 0.006) compared to the normal group.