
Figure 4.
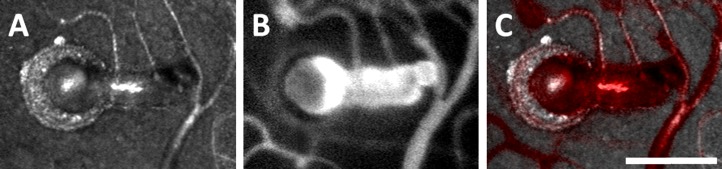
Adaptive optics scanning light ophthalmoscope reflectance (A) and fluorescence (B) images of an irregular MA, nasal to FAZ in Figure 3. The superposition of these images ([C], with [B] in red) shows the relationship between wall and lumen. Scale bar: 100 μm.