Fig. 4.

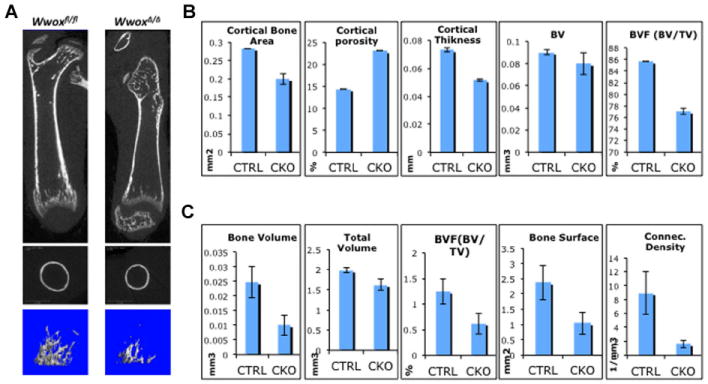
Delayed bone formation in WwoxΔ/Δ mice. A: Microcomputed tomography (μCT) three-dimensional images of control (Wwoxfl/fl) and knockout (WwoxΔ/Δ) at 14 days old mice. Top parts, representative image from the midsection of femur that shows less trabecular bone and a delay in the secondary center of ossification in WwoxΔ/Δ mice; middle parts, cross-section at mid-diaphysis shows thin cortical bone of WwoxΔ/Δ; Lower parts, μCT image of the metaphysis region of Wwoxfl/fl and WwoxΔ/Δ femur at Day 14 showing less volume of trabecular bone. B, C: Quantitation of selected cortical (B) or trabecular (C) bone formation parameters from μCT data analyses as indicated. Parameters of control Wwoxfl/fl mice (CTRL) are compared to those of WwoxΔ/Δ (CKO). P value is at least <0.05.
