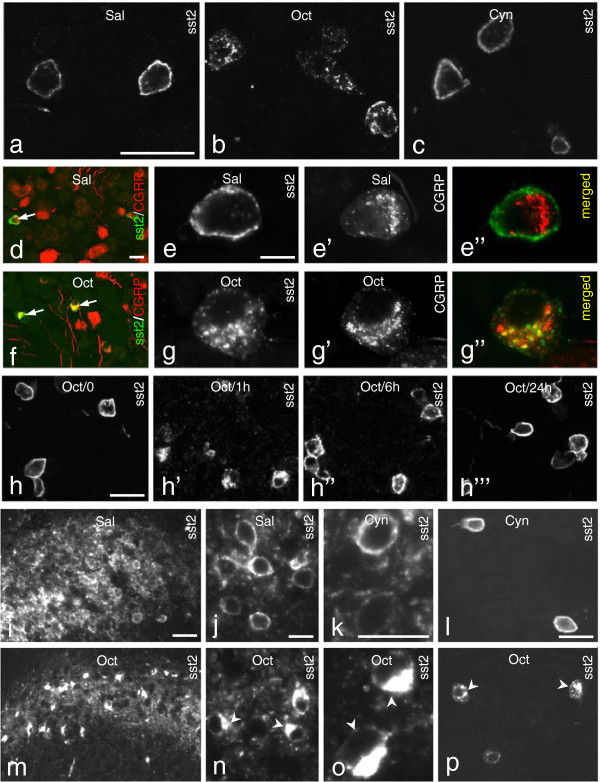
Figure 6.
Trafficking of sst2A-LI induced by Oct treatment. (a-g”) One hr after Oct treatment a strong sst2A-LI is observed in the perinuclear region of the DRG neurons (b), versus plasmalemma localization after saline (a) or Cyn154806 (c). (d-g”) sst2A+ and CGRP+ neurons before and after Oct treatment (arrows in d and f, respectively). In controls sst2A-LI is mainly located on the plasma membrane and CGRP-LI in the perinuclear region (e-e”). After Oct treatment, both CGRP-and sst2A-LI are detected in the perinuclear region (g-g”). (h-h”’) Internalization of sst2A-LI in DRG neurons before (h) or 1 hr (h’), 6 hrs (h”) or 24 hrs (h”’) after Oct administration. (i-p) Internalization of sst2A-LI in the dorsal horn neurons (lamina I-II) 1 hr after ith injection of Oct (m, n, o), not seen after saline (i, j) or Cyn154806 (k). Ith Oct (p), but not Cyn154806 (l), induces internalization of sst2A-LI in DRG neurons. Arrowheads in n, o and p indicate neurons with internalized sst2A. Scale bars indicate 10 μm (j, k), 15 μm (e), 25 μm (i) and 50 μm (a, d, h, l).

