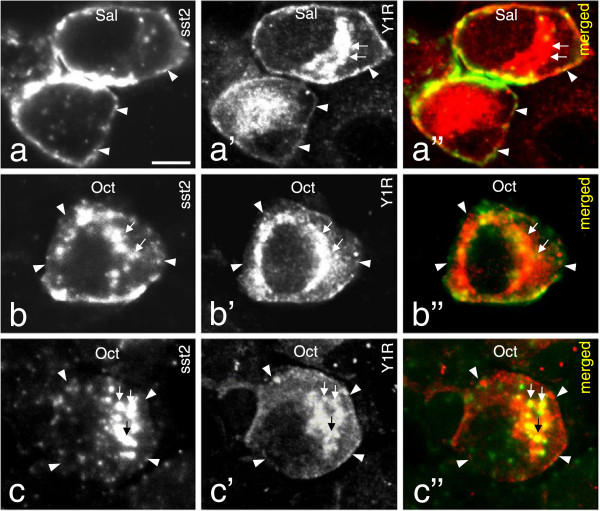
Figure 7.
Systemic administration of Oct induces internalization of both sst2A and Y1R. (a-a”) sst2A and Y1R co-localized at the cell surface in control DRGs. (b-b” and c-c”; show two examples). One hr after Oct treatment sst2A (b, b”, c, c”) and Y1R (b’, b”, c’ ,c”)-LIs are mainly seen in the cytoplasm, partly overlapping. Note that Y1R still can be seen on the membrane (c”). Arrowheads indicate membrane and arrows cytoplasmic staining. Scale bar indicates 10 μm (a).

