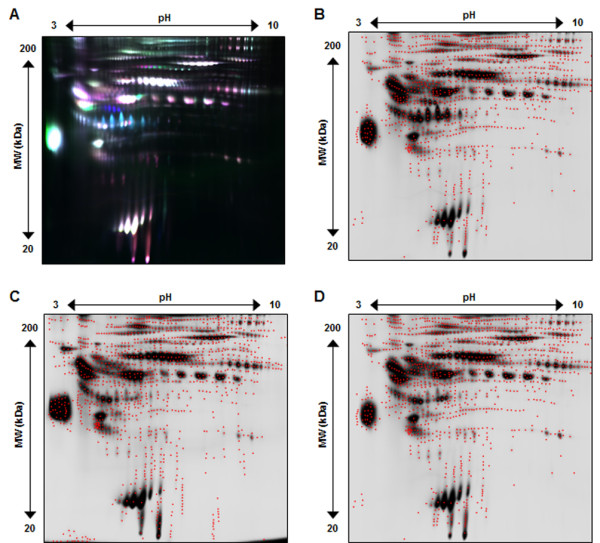
Figure 5.

Representative 2-D DIGE gel image of SERUM after high abundant protein removal. Panel A shows all 3 CyDye fluorescent spot map images overlayed (Cy2/blue, Cy3/green, Cy5/red). Panel B, C, and D illustrate Cy2, Cy3 and Cy5 individual spot maps, where red dots define each of the 1200 total protein spots detected.
