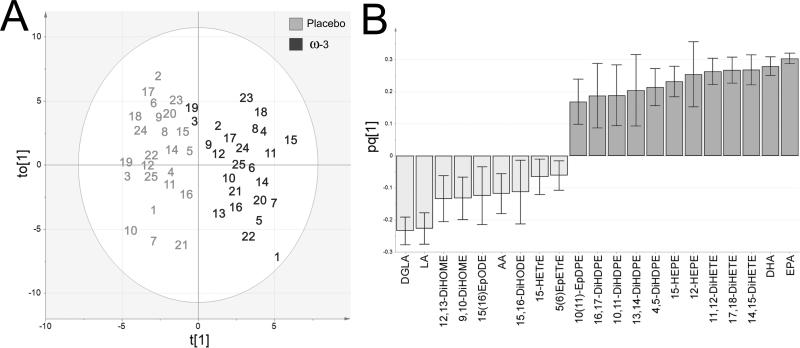
Figure 3.
OPLS-DA model of placebo (light gray) versus ω-3 supplementation (dark gray). (A) Scores plot. The placebo outlier 13 is outside the shown plot range (t[1]:-4.4, to[1]:-14.5). (B) Loadings column plot. Mediators correlating with 95% confidence are shown. The model was built from a single predictive and 1 orthogonal component (R2[cum]=0.81, Q2[cum]=0.78, CVANOVA p-value=2.17E-14).

