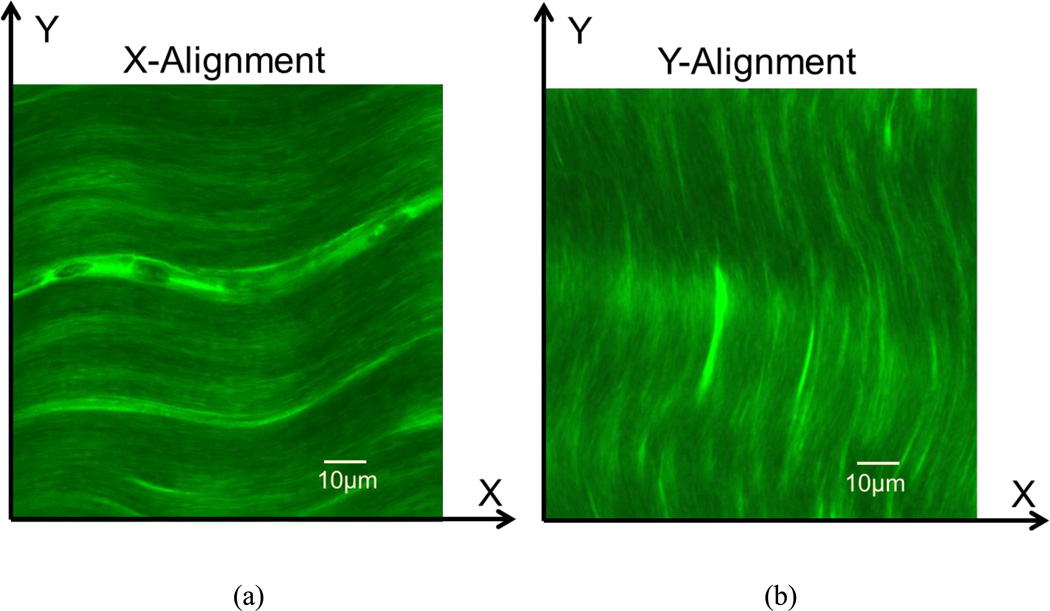
Figure 2.
Two observation protocols for fluorescent solute diffusion measurements in the porcine tendon tissues. X-Y coordinates represent the microscopy coordinates fixed on the microscope sample stage. (a) In the protocol of X-Alignment, the main fiber orientation is aligned with the X-axis. (b) In the protocol of Y-Alignment, the main fiber orientation is aligned with the Y-axis.

