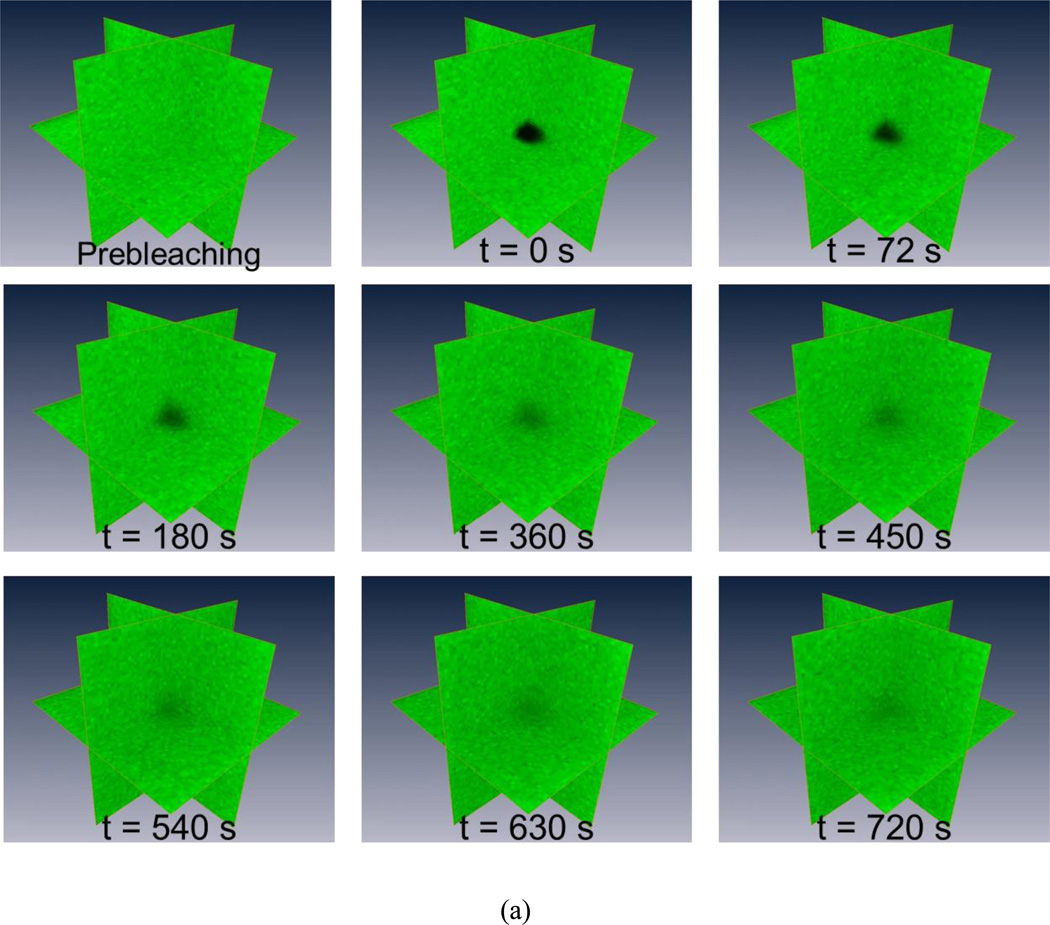
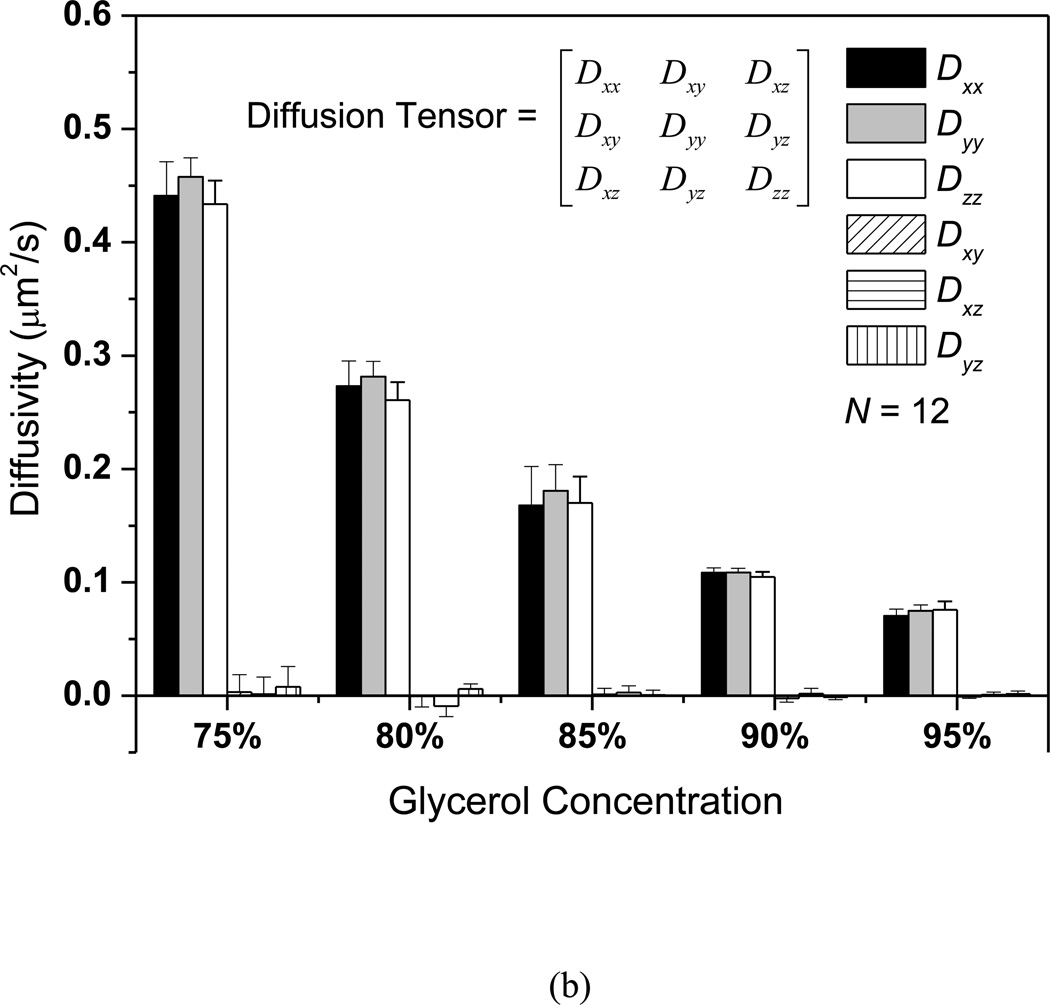
Figure 3.
The 3D isotropic diffusion of FD500 molecule in glycerol/PBS solutions. (a) Typical time series of 3D MP-FRAP Z-stack image of fluorescent solutes for the experimental diffusion measurements in the glycerol/PBS solutions. For each experiment, typically, 40 stacks of post-bleaching images, plus 1 stack prior to photobleaching, are acquired at an approximate rate of 18 seconds/stack. The central region of the observation volume is photobleached by the multiphoton laser and fluorescence recovers completely in the last Z-stack image series (t=720s). (b) The results of 3D diffusion tensors (mean±SD). In each concentration group, there were no significant differences between the diagonal diffusion components (i.e., Dxx, Dyy, and Dzz), while the off-diagonal diffusion components were significantly smaller than the diagonal diffusion components (p<0.0001). Additionally, the nominal diffusivities (tr(D)/3) of FD500 significantly decreased (ANOVA, p<0.0001) with the increasing glycerol concentrations.


