FIG. 5.
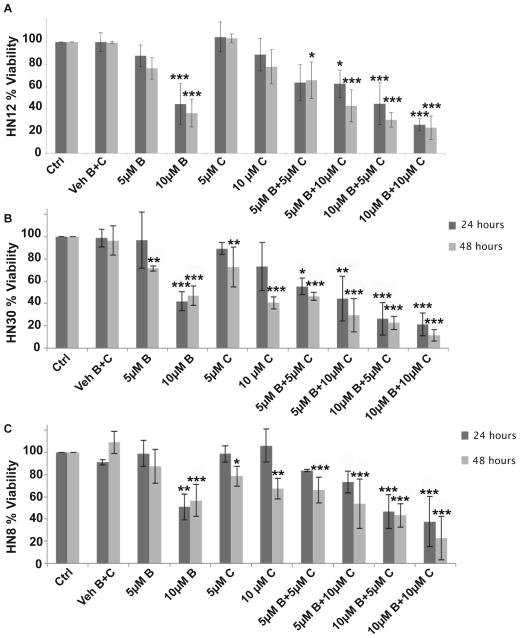
MTT viability assay of HNSCC cells following treatment with BITC, CDDP, or a combination of BITC followed by CDDP compared to controls.
(A) Diagram represents the percent of HN12 viable cells after 24 and 48 hours following BITC, CDDP, or a pretreatment of BITC followed by a CDDP treatment (24 hours CI= 0.86; 48 hours CI= 0.93).
(B) Diagram represents the percent of HN30 viable cells after 24 and 48 hours following BITC, CDDP, or a pretreatment of BITC followed by a CDDP treatment (24 hours CI= 0.79; 48 hours CI= 0.52).
(C) Diagram represents the percent of HN8 viable cells after 24 and 48 hours following BITC, CDDP, or a pretreatment of BITC followed by a CDDP treatment (24 hours CI= 1.09; 48 hours CI= 0.73).
Dark grey bars indicate cell viability at 24 hours; light grey bars indicate cell viability at 48 hours. Error bars represent standard deviation. One-way ANOVA for multiple comparisons with Dunnet’s Post-Hoc test (*p ≤ 0.05; **p ≤ 0.001; ***p≤0.0001).

