
Figure 7.
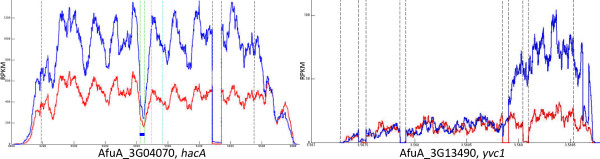
RNA-seq coverage plots for the hacA and yvc1 mRNAs. The number of sequence reads on the y-axis (reads per kilobase per million) is shown along the length of each gene in the absence (red) or presence (blue) of ER stress (1 mM DTT, 1 h). Vertical lines demarcate predicted intron boundaries (shown in green for the unconventional intron in hacA). The coverage plot for yvc1 shows an increase in reads at the 3′ end of the gene specifically in the presence of ER stress.