Figure 3.
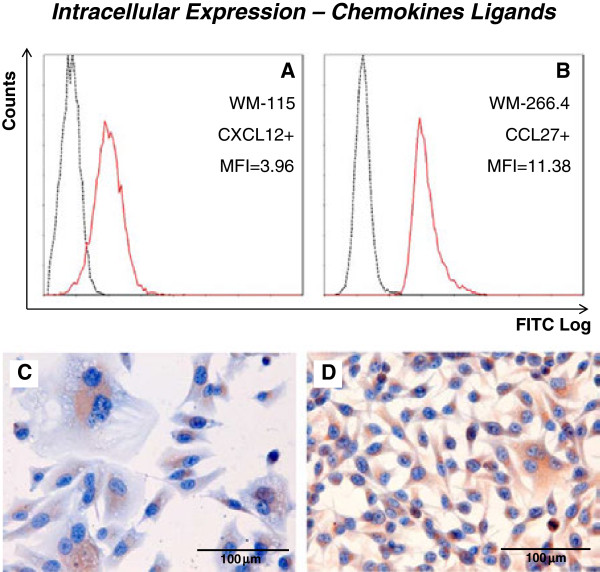
Intracellular expression of chemokines. Representative examples for the quantification of intracellular chemokine expression by both flow cytometry (A, B) and immunocytochemistry (C, D) are shown. Mean fluorescence indexes and overlaid histograms of PE fluorescence of specific anti-receptor monoclonal antibody (continuous red line) and correspondent isotypic control (discontinuous black line) are shown for CXCL12 in the WM-115 cell line (A) and for CCL27 in the WM-266.4 cell line (B). Corresponding immunocytochemical staining of CXCL12 in WM-115 (C) and CCL27 in WM-266.4 (D).

