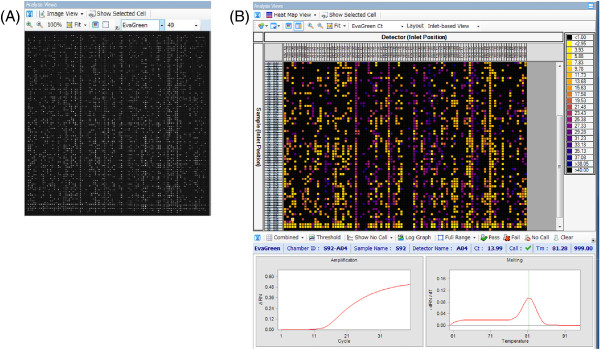
Figure 3.

Images of results in the BioMarkTM HD system. (A) Image view of the raw fluorescence for a dynamic array. Each white point indicates one reaction as represented by the fluorescence concentration. (B) A heat map view converted from the Image view.
