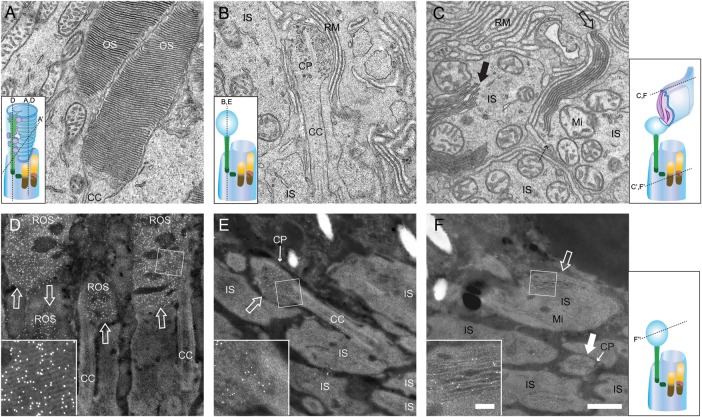
Figure 2.
TEM images and immuno-EM labeling of Rho+/+ and RhoP23H/P23H mouse retinas reveal transport of P23H opsin to ROS. TEM images are shown of photoreceptor cell outer segments (OS) in Rho+/+ mice (A) and RhoP23H/P23H mice (B and C). Samples were prepared from PND12 mice. At this PND12, Rho+/+ mice exhibited a stack of discs (A). In contrast, RhoP23H/P23H mice featured CPs (B) or packs of elongated discs (C,  ) or disc-like structure inside IS (C,
  ). Note that the plasma membrane between the elongated discs and the IS, indicated by dashed arrow, is not clearly resolved (C), indicating that the plasma membrane around the elongated discs is not continuous with the IS plasma membrane. Immuno-EM images of ROS in Rho+/+ (D) and RhoP23H/P23H mice (E and F) at PND12 (Rho+/+) and PND12 (RhoP23H/P23H). Opsin antibody signals were detected with 5 nm gold particle conjugated secondary antibodies. To enhance membrane structures in immuno-EM samples, scanning transmission electron microscopy (STEM) was used to obtain images. Gold particle signals appearing as white dots were specifically localized in stacks of rod discs in Rho+/+ mice (D,
  ). In contrast, these signals were found in CPs (E,
  and transversely sectioned in F, solid white
  ) and elongated discs (F,
  ) in RhoP23H/P23H mice. Higher magnification images (D–F) are shown in the insets. OS, photoreceptor cell outer segment; IS, photoreceptor cell inner segment, CP, ciliary protrusion; RM, retinal pigment epithelium microvilli; CC, connecting cilium; Mi, mitochondria; ROS, rod photoreceptor cell outer segment. Hypothetical diagrams of photoreceptor cells are included, indicating the cutting planes with dashed lines. Scale bar: 500 nm (A–F); 100 nm (D–F, insets).

