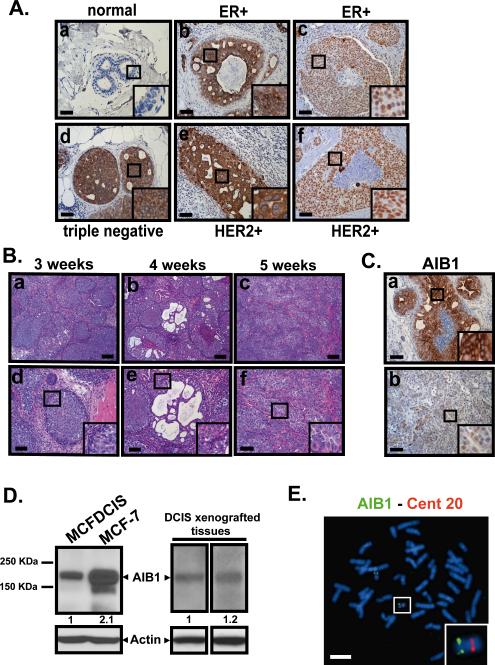
Fig. 1. AIB1 expression in DCIS.
(A) Representative images of IHC staining using AIB1 antibody (5E11, Cell Signaling Technology, 1:75) in normal breast (a) and human comedo DCIS associated with invasive lesions obtained from ER+ (b,c), triple negative (d) and HER2+ specimen (e,f). (B) H&E stained images of tissue sections from MCFDCIS xenograft tumors at 3, 4 and 5 weeks. (a-c) scale bar = 0.2 mm. (d-f) scale bar = 0.1 mm. (C) Representative images of IHC staining for AIB1 in MCFDCIS xenograft tumor tissues. Scale bar= 0.1 mm. (D) Western blot analysis using AIB1 (5E11, Cell Signaling Technology, 1:1000) and β-actin (C4 Millipore, 1:3000) antibodies in protein lysates from MCFDCIS and MCF-7 cells in vitro (left) and from MCFDCIS tumor tissues (right). (E) Representative metaphase spread of MCFDCIS cells hybridized with bacterial artificial chromosome clones (RP11-1151C1 and RP11-976F15) containing sequences of the AIB1 gene located at 20q12. Note two copies of the AIB1 gene (green signals) and centromeric control probe for chromosome 20 (RP11-90H19)(red signals). Scale bar= 20 μm. Insets outline a zoom-in of the framed areas.

