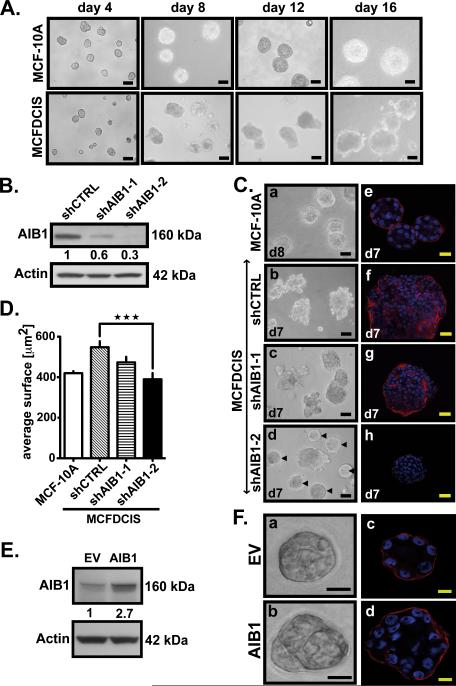
Fig. 2. Decrease in AIB1 levels results in a reversion of MCFDCIS acini to more normal acinar structures in 3D culture.
(A) Representative phase-contrast images of MCF-10A cells (upper) and MCFDCIS cells (lower) cultivated on Matrigel™ at day 4, 8, 12 and 16. Acini were analyzed and photographed using an Olympus IX-71 Inverted Epifluorescence Scope and DP controller Software version 3.1.1.267. Scale bar= 0.1 mm. (B) Western blot analysis of AIB1 and β-actin expressions in MCFDCIS cells infected with control or AIB1 shRNAs. (C) Representative phase-contrast images of MCF-10A acini at day 8 (a) and MCFDCIS acini infected with lentiviral shRNA control or AIB1 shRNA at day 7 (b) to (d). Normal-appearing acinar structures are indicated by arrows in (d). Scale bar= 0.1 mm. Representative immunofluorescence pictures of MCF-10A acini at day 8 (e) and MCFDCIS acini expressing control (f) or AIB1 shRNAs at day 7 (g, h) stained with laminin V antibody (Millipore, 1:100)(red signals) and with Dapi (blue signals), and analyzed using an Olympus FV300 Confocal microscope equipped with Fluoview 300 Software. Scale bar= 20 μm. (D) Average size of MCF-10A and MCFDCIS acini determined by microscopic area measurements (Nuance software ; n=100 ; ***, p<0,0001 vs. control). (E) Western blot analysis using AIB1 and β-actin antibodies in protein lysates from MCF-10A cells infected with a lentivirus containing AIB1 or control vector. AIB1 protein levels indicated under the western blot were quantified using ImageJ 1.33u software and normalized to β-actin. (F) Representative phase-contrast (a,b) and immunofluorescence images (c,d) of MCF-10A acini overexpressing AIB1 (b,d) or not (a,c) at day 10. Acini were stained for Laminin V (red signals) and with Dapi (blue signals). Scale bar= 10 μm.

