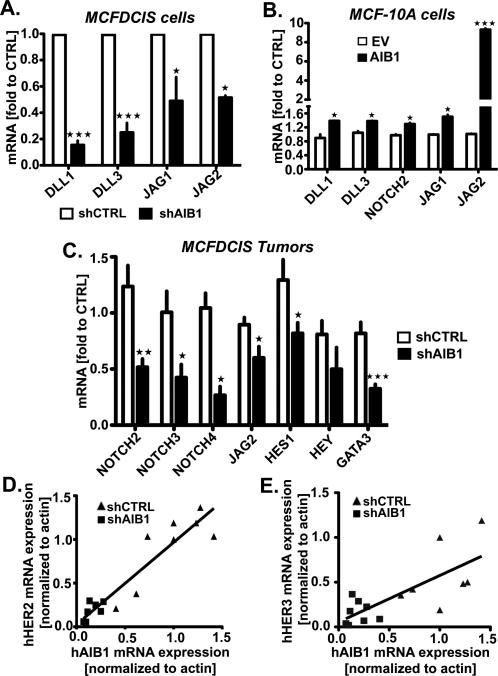
Fig. 6. AIB1 regulates NOTCH and HER signaling pathways in MCFDCIS xenografts.
(A) qRT-PCR analysis of DLL1, DLL3, JAG1, and JAG2 in MCFDCIS cells deficient (n=3) or not (n=3) in AIB1, (B) DLL1, DLL3, NOTCH2, JAG1 and JAG2 in MCF-10A overexpressing AIB1 (n=3) or not (n=3), and (C) NOTCH2, NOTCH3, NOTCH4, JAG2, HES1, HEY, and GATA3 in shCTRL (n=15) or shAIB1 (n=11) MCFDCIS xenografted tissues. Mean ± SEM (n≥3; *, p<0.01 vs. control; **, p<0.001 vs. control; ***, p<0.0001 vs. control). (D) Scatter plot representation of the correlation between human AIB1 (hAIB1) and human HER2 (hHER2) mRNA expression or (E) human HER3 (hHER3) mRNA expressions analyzed by qRT-PCR in xenografted tumors from MCFDCIS shCTRL (n=15) or shAIB1 (n=11). The solid lines show the positive linear regression fit. Goodness of fit (A, r2=0,8771; B, r2 0,5519).

