
Figure 3.
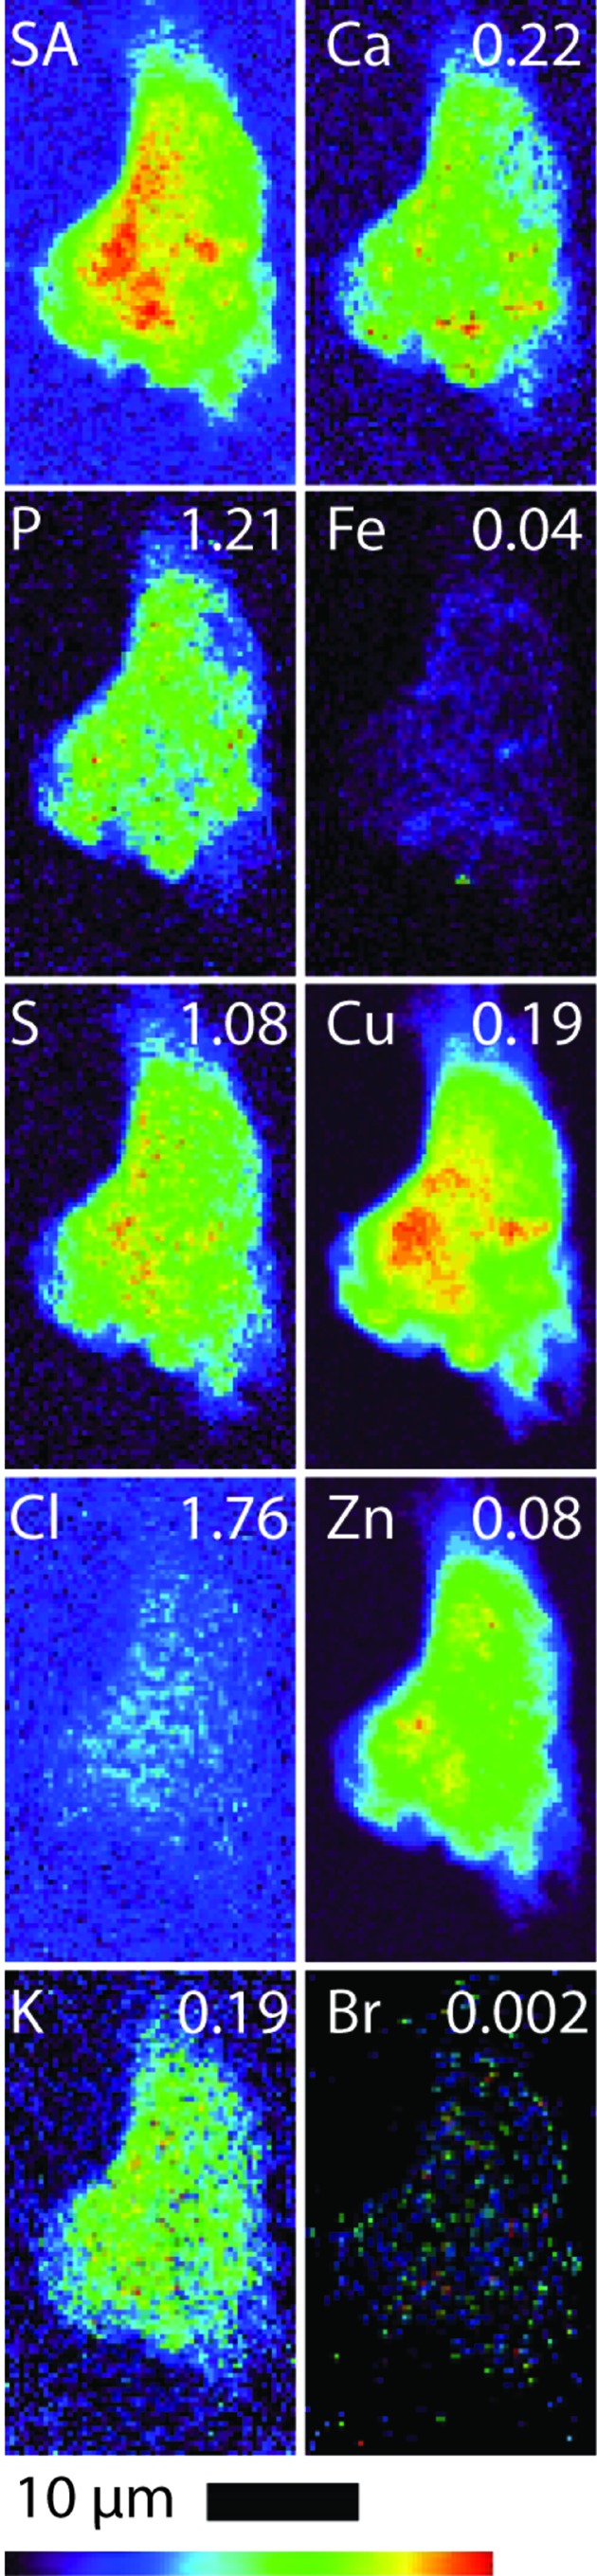
Scattered X-ray (SA) and XRF elemental distribution maps of P, S, Cl, K, Ca, Fe, Cu, Zn and Br of an untreated B16 cell. The maximal elemental area density (in µg cm−2) is given in the top corner of each map.
Official websites use .gov
A
.gov website belongs to an official
government organization in the United States.
Secure .gov websites use HTTPS
A lock (
) or https:// means you've safely
connected to the .gov website. Share sensitive
information only on official, secure websites.
Scattered X-ray (SA) and XRF elemental distribution maps of P, S, Cl, K, Ca, Fe, Cu, Zn and Br of an untreated B16 cell. The maximal elemental area density (in µg cm−2) is given in the top corner of each map.