
Figure 4.
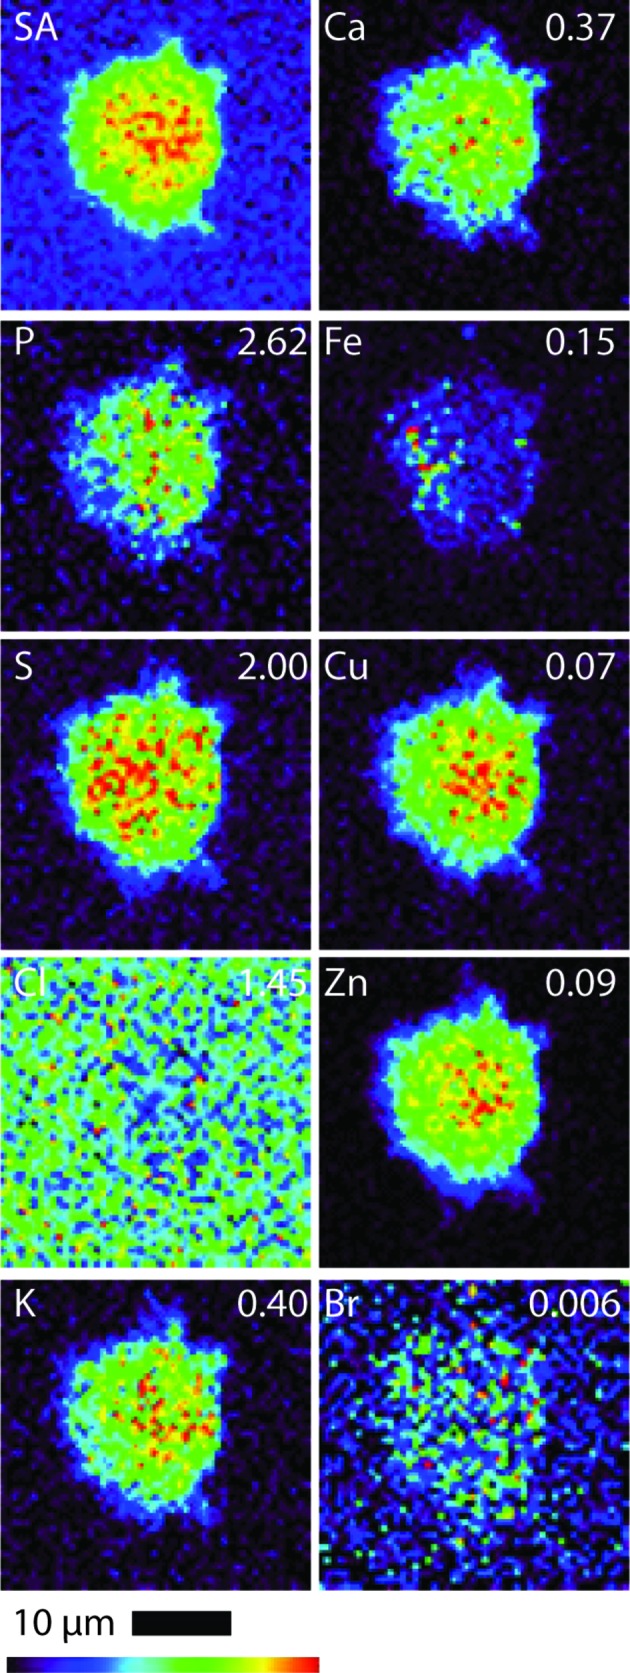
Scattered X-ray (SA) and XRF elemental distribution maps of P, S, Cl, K, Ca, Fe, Cu, Zn and Br of an A549 cell treated with 1 for 24 h. The maximal elemental area density (in µg cm−2) is given in the top corner of each map.
Official websites use .gov
A
.gov website belongs to an official
government organization in the United States.
Secure .gov websites use HTTPS
A lock (
) or https:// means you've safely
connected to the .gov website. Share sensitive
information only on official, secure websites.
Scattered X-ray (SA) and XRF elemental distribution maps of P, S, Cl, K, Ca, Fe, Cu, Zn and Br of an A549 cell treated with 1 for 24 h. The maximal elemental area density (in µg cm−2) is given in the top corner of each map.