Figure 7.

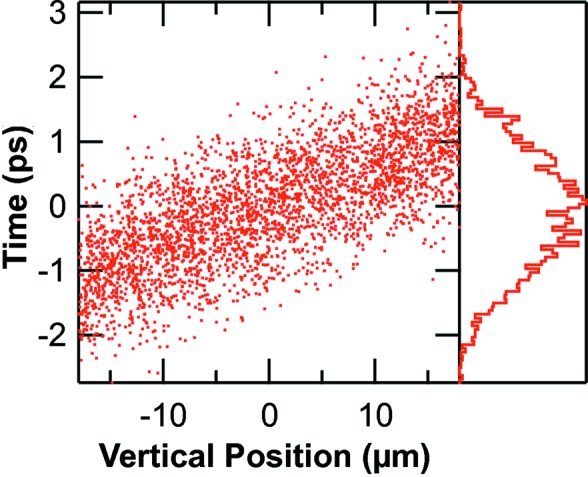
Correlation between time and vertical position at the entrance slit. The right-hand histogram shows the distribution in time.

Correlation between time and vertical position at the entrance slit. The right-hand histogram shows the distribution in time.