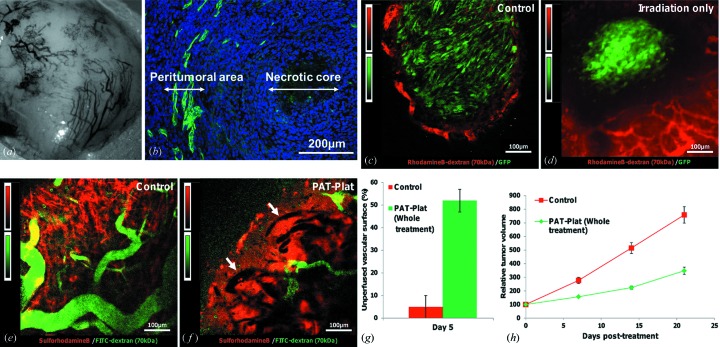
Figure 2.
Effects of the treatment on tumor vasculature. (a) Macrophotography of the surface of the F98 glioma implanted in the hindlimb of a mouse after the removal of the skin. (b) Immunohistochemistry performed on a section in the middle of a F98 glioma. Green: immunolabelling of the collagen IV indicating the basal lamina of the vasculature in the peritumoral area; blue: cell nuclei stained with Hoechst 33342. Note the necrotic core at the center of the tumor. (c) Two-photon imaging of an untreated F98-GFP glioma at day 5 after the beginning of the study. Green: GFP-F98 glioma cells; red: rhodamineB-dextran 70 kDa dye staining of blood vessels. Only the tumor periphery is perfused until a maximum depth of approximately 100 µm. All two-photon images, (c)–(f), were taken at a depth of 50 µm beneath the surface of the tumor. (d) Two-photon imaging of a F98-GFP glioma at day 5 after receiving 15 Gy 79 keV tomographic synchrotron irradiation. Green: GFP-F98 glioma cells; red: rhodamineB-dextran 70 kDa dye staining the blood vessels. The tumor periphery is still perfused. The solid tumor mass decreased; see the empty space between functional red vessels and the green tumor cells. In comparison with the control tumors (c), cell morphology has changed from elongated shapes into round shapes. (e) Two-photon imaging of an untreated F98 glioma at day 5 after the beginning of the study. Green: vasculature labeled by FITC-dextran 70 kDa; red: sulforhodamineB dye extravascated in the extravascular extracellular tumor volume in order to obtain a better contrast. A rolling-ball background subtraction with a radius of ten pixels was applied (with this method, a local background value is determined for every pixel by averaging over a very large ball around the pixel; this value is then subtracted from the original image, removing variations of the background intensities). Note that for the staining of the functional vessels, FITC-dextran (green signal) instead of rhodaminB-dextran (red signal) is used. (f) Two-photon imaging of a F98 glioma at day 5 after the whole treatment. Note that the non-perfused vessels areas appear dark (see white arrows) and a few functional vessels show up green after perfusion with FITC-dextran surrounded by a red SRB staining of the whole extravascular volume. A rolling-ball background subtraction with a radius of ten pixels was applied. (g) Unperfused vascular surface (%) in control (group 1) and PAT-Plat (group 4) animals at five days post-treatment. (h) Tumor growth in control (group 1; red squares) and PAT-Plat (group 4; green diamonds) animals during the first three weeks post-treatment. The decrease of the perfused vascular surface observed in PAT-Plat animals (g) can be correlated with the reduction of the tumor growth.

