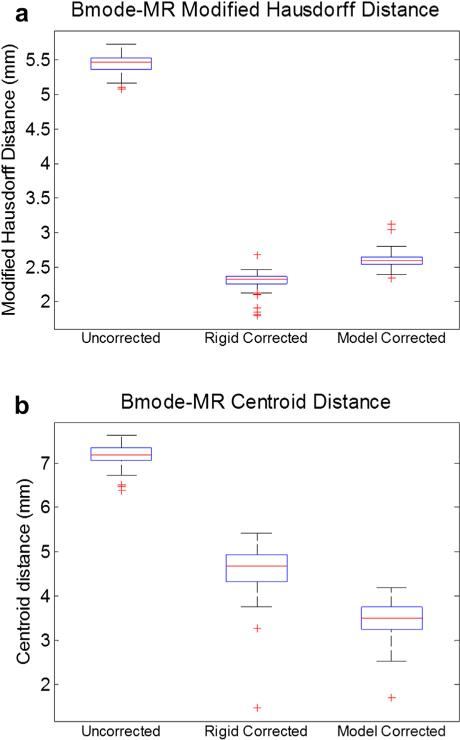
Fig. 9.
Alignment error results for the clinical case (n = 118 B-mode images). The position of tumor borders was evaluated in terms of modified Hausdorff distance to the co-aligned magnetic resonance image borders (a), as well as the distance between the centroid of the ultrasound tumor and the co-planar MR tumor border (b). The edges of the boxes are the 25th and 75th percentiles, and the whiskers extend to the most extreme data points not considered as outliers.

