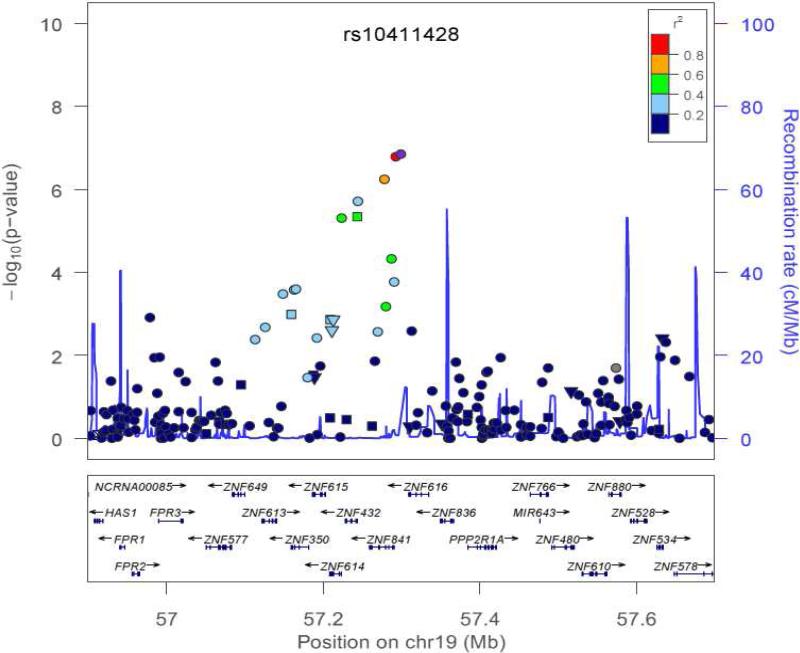
Figure 3.
Region of association near rs10411428 to bronchodilator response while modulated by treatment with inhaled corticosteroids. The x-axis denotes position along chromosome 19. The y-axis denotes –Log10 (P) corresponding to 1000GP imputed data P-values between the SNP, rs10411428, to each SNP in the plot is denoted in colors and was computed according to 1000GP June 2010 CEU data. Plot was created using LocusZoom.22

