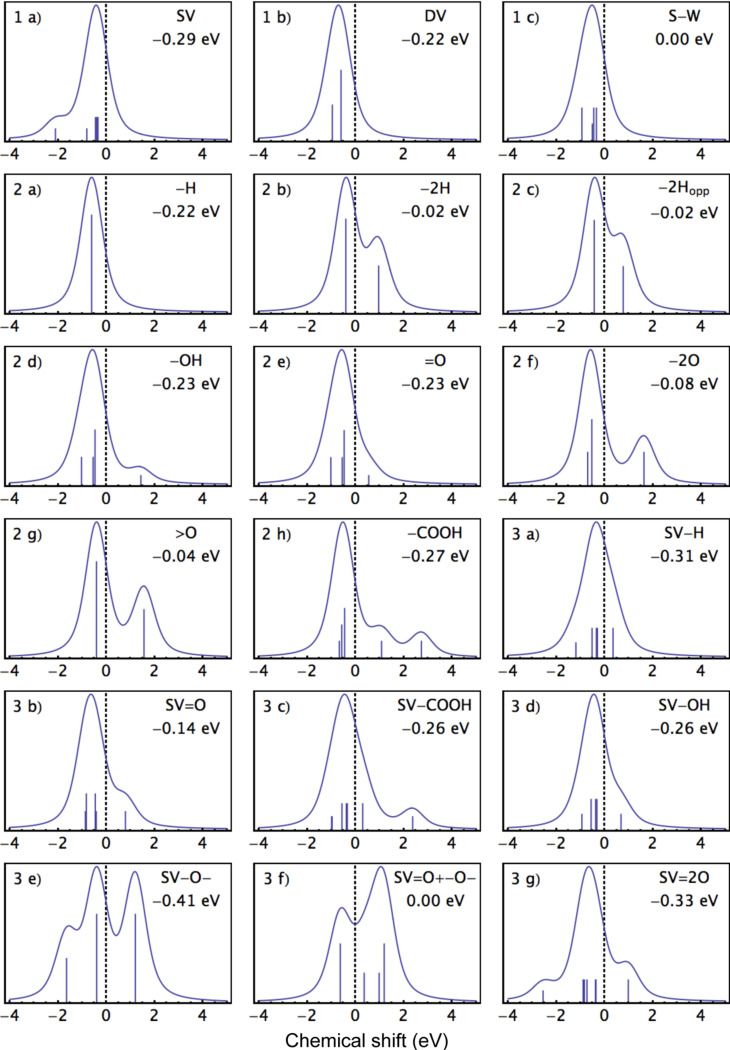
Figure 4.
The calculated line shapes, in which peaks with shifts smaller than 0.3 eV from the system bulk value have been suppressed. The identifier in the top left corner of each panel refers to the corresponding structures in Figures 1–3, while the energy inset under the system identifier in the top right corner denotes the shift of the system bulk value compared to that of pristine graphene. The vertical lines represent the shifts of the calculated binding energies with respect to the system bulk value, weighted by the number of atoms for each calculated energy and scaled for clarity.

