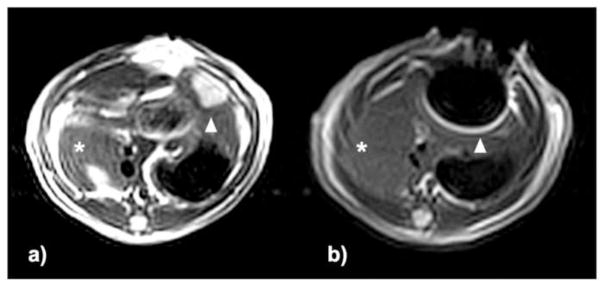
Figure 5.

T2w TSE images (axial view) (a) pre- and (b) post-injection. Within T2w images, left lateral lobe tumors were hyperintense relative to adjacent NHP (arrowhead indicates tumor position) and normal median lobe (asterisk). Post-injection images show signal voids corresponding to the location of the tumor and bright pile-up artifacts (arrowhead) in the phase-encoding direction that were not present in the normal median lobe (asterisk).
