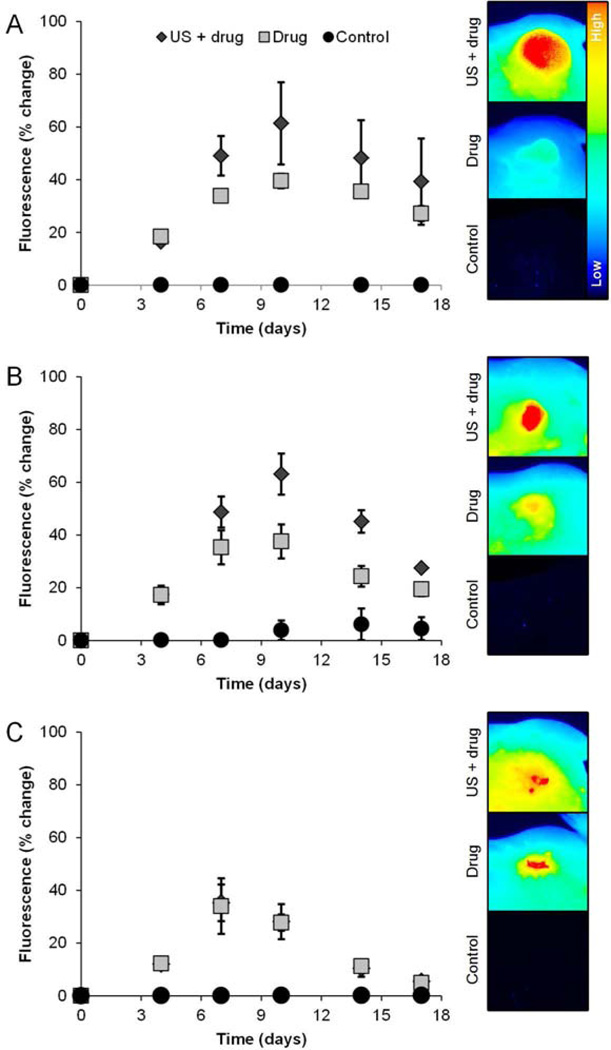
Figure 5.
Fluorescence imaging of drug uptake at the target tumor site. Line plots detail data acquired in the following animal groups, namely, (a) 0%, (b) 50% and (c) 100% tumor resection exposed to either US-stimulated drug delivery (denoted US + drug), systemic drug treatment alone, or sham (control) treatment (left). Note that animals treated with US-stimulated drug delivery tended to exhibit enhanced drug uptake compared to those dosed with drug only and control animals. Representative optical images of tumor fluorescence acquired on the last day of drug treatment (day 10 of the study) are presented and illustrate spatial distribution of drug accumulation in the target tumor (right).

